
Fig. 10.
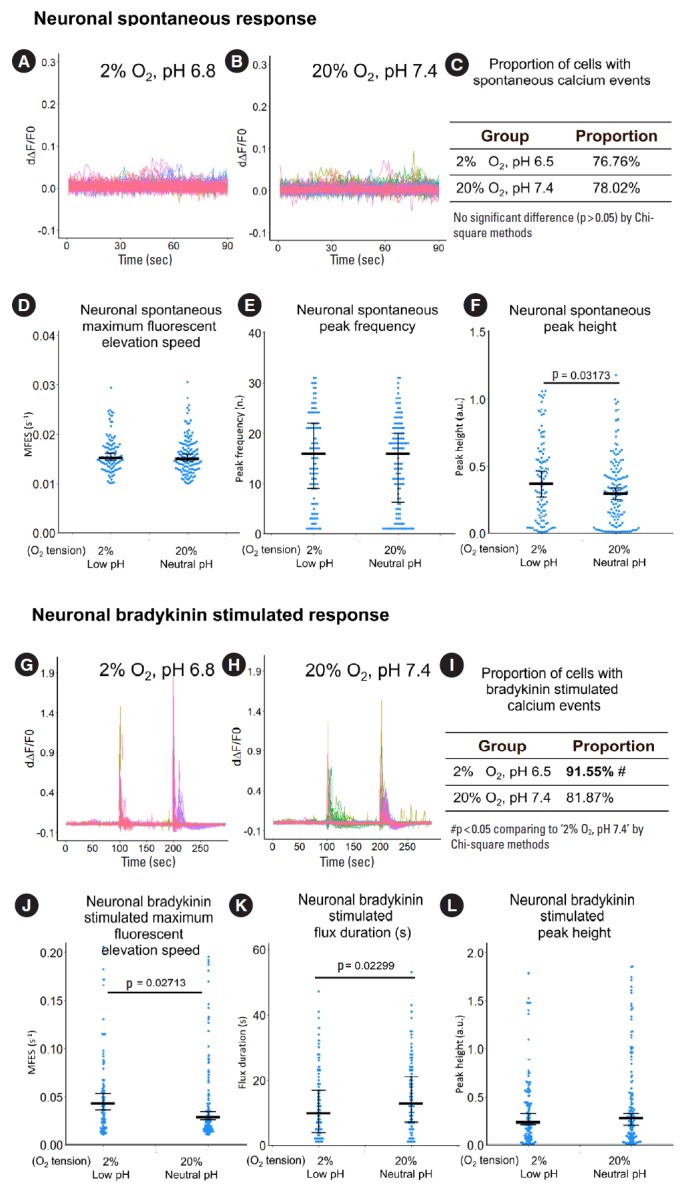
The influence of hypoxia and low pH on calcium response of primary sheep DRG neuron. (A, B) Derivative fluorescent curve from 0 to 90 seconds which represent spontaneous response of the neurons. Each colored curve represents one neuronal structure. (C-F) Quantification of the spontaneous response using proportion of cells with calcium events, maximum fluorescent elevation speed, peak frequency, and peak height based on the derivative curve. (G, H) Derivative of fluorescent curve from 0 to 300 seconds. Bradykinin (0.5 μM) was added at the 100 seconds to evaluate the bradykinin-stimulated response while potassium chloride (50 mM) was added at the 200 seconds to differentiate neuronal structures from nonneuronal structures. Each curve represents one neuronal structure. (I-L) Quantification of the bradykinin-stimulated response using proportion of cells with calcium events, maximum fluorescent elevation speed, flux duration, and peak height based on the derivative curve. For panels A, B, G, H, peaks in the curve are regarded as calcium events which indicate neuronal discharge. The y-axis is the derivative level of normalized fluorescent (ratio of F-F0 and F0). Around n=140 to 180 neuronal structures per group were included for this study. For panels C, I, the definition of calcium event is the peak in the derivative curve larger than 0.05/sec. Chi-square method was used for statistics. For panels D, E, F, J, K, L, blue spots in the plots show data distribution; black bar represents median; error bars in panels D, F, J, and L show 95% confident interval of median (calculated using bootstrapping method); while error bar in panels E and K show 25% and 75% quantile. A p-value was calculated using pairwise comparisons of Wilcoxon rank sum test. A value of p<0.05 was regarded as significant and those values were shown in the plots. IVD, indirectly via intervertebral disc; CM, conditioned medium; DRG, dorsal root ganglion.