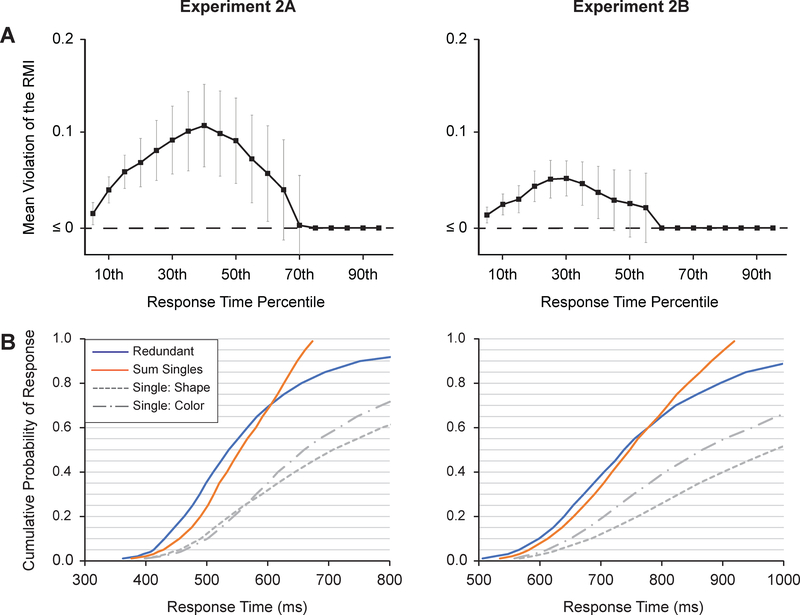
Figure 5.
A) Violation plots for Experiment 2. Mean violations of the race model inequality for the separated cue condition as a function of whether the response was a present/absent decision (Experiment 2A) or report of a secondary feature of the target object (Experiment 2B). Error bars are condition-specific, within-subject 95% confidence intervals (Morey, 2008). B) Aggregate cumulative distribution functions (CDFs) for the single-target conditions and the redundant-target condition. The orange line shows the sum of the two single-target CDFs. Given differences in the method of aggregation, there may be subtle variations between the CDFs reported in Panel B and the mean difference scores reported in Panel A.

