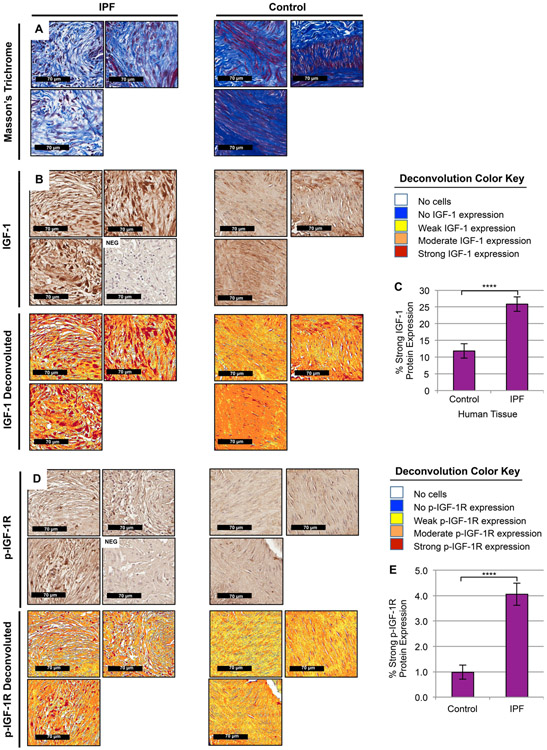
Figure 4. IGF-1 and phosphorylated-IGF-1R are upregulated in IPF Fibroblastic Foci.
(A, B, D) Representative images (30x magnification) from histological sections of control (right, n=7, areas of normal human lung enriched with fibroblasts) and fibrotic (left, n=12, IPF fibroblastic foci) patient tissue were stained with Masson’s Trichrome (A, top) to visualize lung tissue architecture (purple, nuclear; pink, cytoplasmic) and collagen composition (blue, collagen fibers), anti-IGF-1 antibodies (B, middle), anti- phosphorylated-IGF-1R antibodies (D, bottom) co-stained with Hematoxylin, or negative controls without primary antibody co-stained with Hematoxylin (NEG). Color deconvoluted images (B, D) show the area and intensity of IGF-1 ligand (B) or phosphorylated-IGF-1R (D) present in regions of human lung enriched with proliferating myofibroblasts in fibroblastic foci compared to fibroblasts in supportive pulmonary structures per the deconvolution color key and quantified using a pixel count algorithm (C, E). Data are presented as means −/+ Standard Error of the Mean (SEM) for the number of biological replicates indicated (n). Statistical significance was determined after computing single factor ANOVA and/or unpaired two-tailed Student’s t-test (p<0.05 (*), p<0.01 (**), p<0.005 (***), p<0.001 (****). Results demonstrate that IGF-1 ligand and IGF-1R activation are increased in IPF fibroblastic foci.

