
Figure 7: Effects of knockdown of mitochondrial fission factor (MFF) on progesterone production and DRP1 localization in bovine small luteal cells.
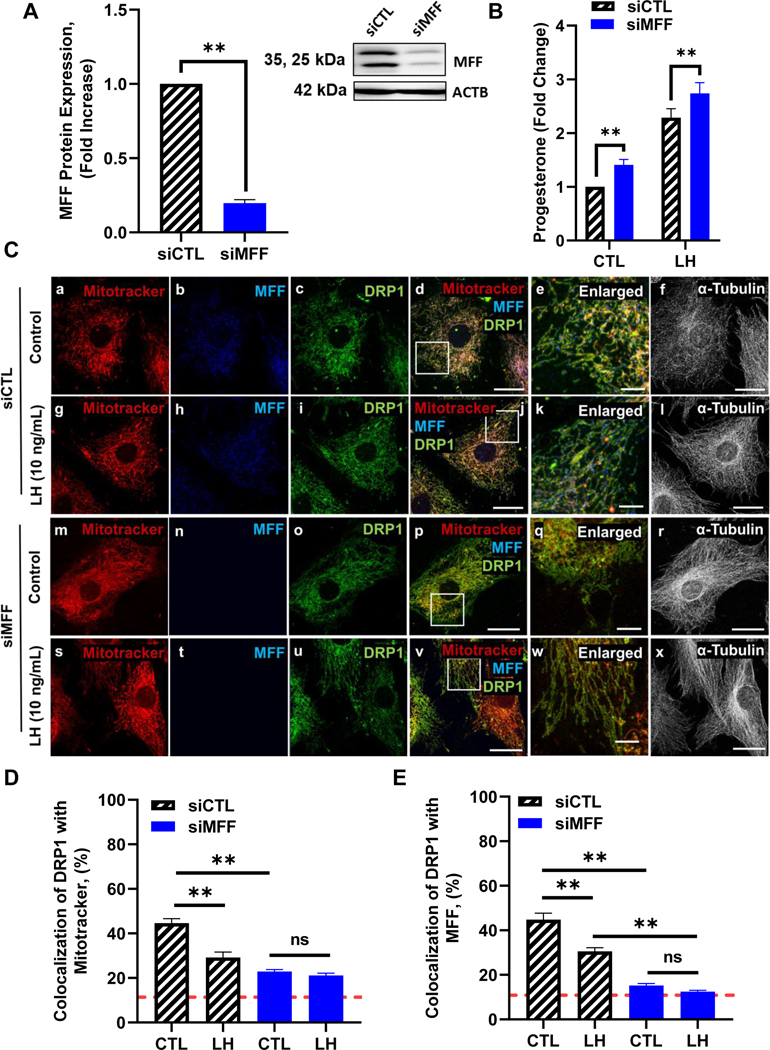
Mitochondrial fission factor (MFF) mRNA was silenced using siMFF in small bovine luteal cells. Following knockdown, cells were treated without (Control) or with luteinizing hormone (LH; 10 ng/mL) for 4 h. Panel A: Densitometric analyses of MFF protein expression. Bars represent means ± sem, n = 4. Inset representative western blot analysis showing expression of MFF in siMFF knockdown small luteal cells. Panel B: Medium progesterone. Bars represent means ± sem, n = 6. *Significant difference between treatment as compared to control, P < 0.05. **Significant difference within treatment (CTL or LH), P < 0.05. Panel C: Representative micrographs of (left to right) Mitotracker (a, g, m and s), MFF (b, h, n and t), DRP1 (c, i, o and u), merge of Mitotracker, MFF, and DRP1 (d, j, p and v), enlarged inlet of colocalization (e, k, q and w), and alpha-Tubulin (f, l, r and x) and (top to bottom) siCTL (a-f), siCTL + LH (10 ng/mL; g-l), siMFF (m-r) and siMFF + LH (10 ng/mL; s-x), enlarged image (white box corresponding to adjacent image). Panel D: Quantitative analysis of the colocalization of DRP1 with Mitotracker. Panel E: Quantitative analysis of the colocalization of DRP1 with MFF. Bars represent means ± standard error; n = 3. Red dashed line indicated analysis cut-off set at 10% colocalization. **Significant difference between treatment (control vs LH), P < 0.05.