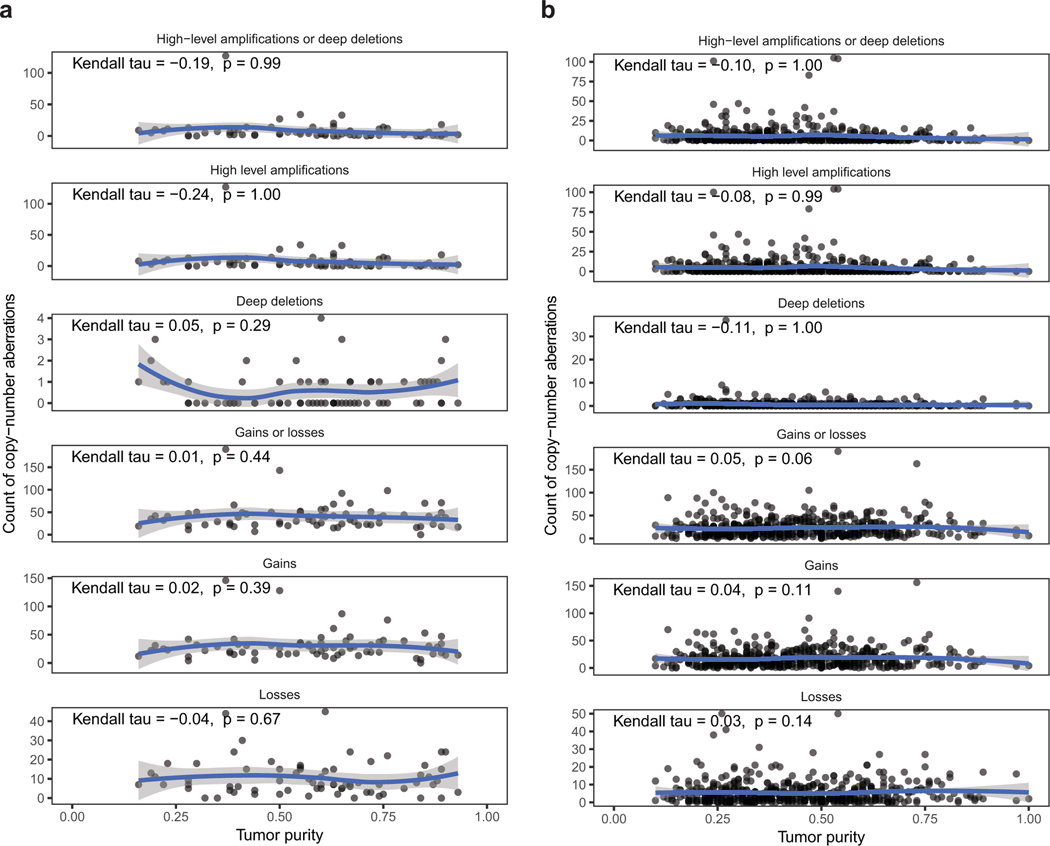
Extended Data Fig. 6.
Power analysis and statistical simulation of case-control study.
Dot plot of frequencies of copy-number events and tumor purity in BM-LUAD (a) and TCGA-LUAD (b).
Correlations are measured by Kendall rank correlation coefficient. Blue curves represent LOESS regressions.
High-level amplification, > 8 total copy-number; Deep deletion, < 0.5 total copy-number;
Gain, > 3/2 normalized copy-ratio; Loss, < ½ normalized copy-ratio.
Normalized copy-ratio is total copy-number scaled to tumor ploidy.

