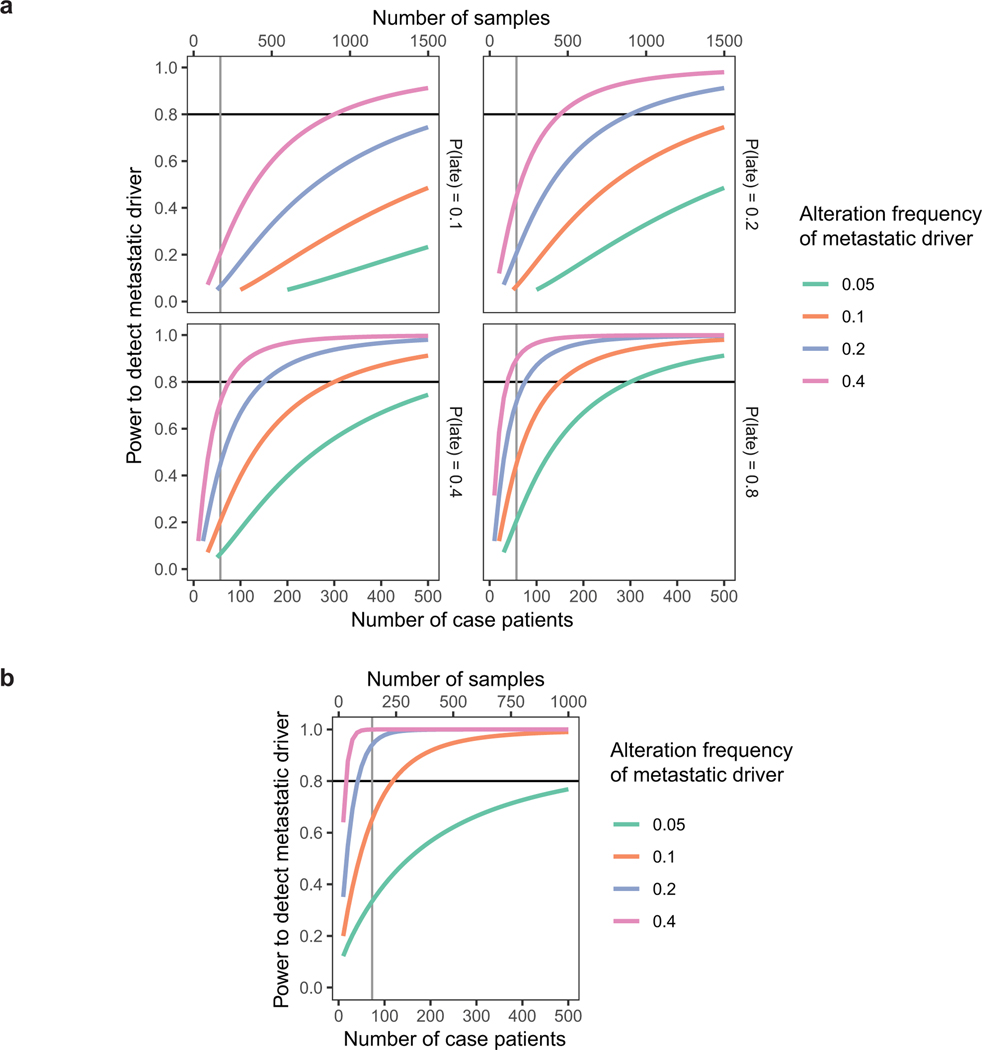
Extended Data Fig. 8.
Power analysis and statistical simulation of case-control study.
a, Estimated powers to detect metastatic driver under a matched-pairs primary-metastasis comparison study. Levels of driver alteration frequency among cases are shown in different line colors. Various probabilities of driver alteration occurring late during metastatic progression (see Fig. 3) are considered in separate subplots. Power is calculated for Poisson regression comparing absolute frequencies of late driver alterations against frequencies of late background alterations (which was estimated to be 1.0 from recurrently altered genes). Observations are assumed to be independent and identically distributed. Each case patient requires the processing of 3 samples (brain metastasis, matched primary tumor, and matched germline).
b, Estimated powers to detect metastatic driver under a case-control study. Levels of driver alteration frequency among cases are shown in different line colors. The driver alteration frequency is assumed to be 1% among TCGA-LUAD patients who do not develop brain metastasis (true controls). Power analysis corrects for the estimated 30% incidence of brain metastasis among TCGA-LUAD patients (cases-in-controls contamination). Each case patient requires the analysis of 2 samples (brain metastasis and germline).
Significance level is set to 0.05. Vertical line represents the realized sample size.

