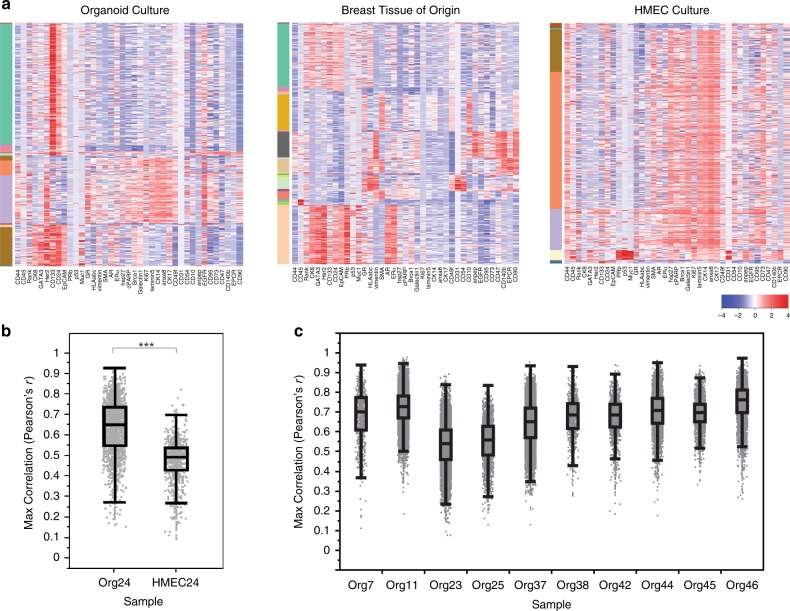
Fig. 5. Analysis of matched organoid culture, HMECs, and primary tissue by CyTOF.
Mammary tissue was dissociated and used to generate an organoid culture (ORG24) as well as a standard two-dimensional HMEC culture (HMEC24). Cells from the tissue was also directly fixed and frozen for future analysis. Cells from the cultures in conjunction with cells from the tissue were analyzed by CyTOF. a Heatmaps show single cells from the cultures or matched tissue as indicated, with color bar on left indicating different X-shift defined clusters. b Correlation between the protein expression profiles of HMEC or organoid cell and expression signatures derived from the major epithelial clusters in matched primary tissue. Box plots (center line, median; box limits, upper and lower quartiles; whiskers, 1.5× interquartile range) show the maximum r value of each cell to the major epithelial clusters, stratified by sample. Statistical significance was assessed by two-sided Mann–Whitney test (***p < 2.2e−16). c Correlation analysis as in b, performed for the indicated ten organoid cultures as compared with a set of four nonmatching primary breast tissues.

