Figure 3.
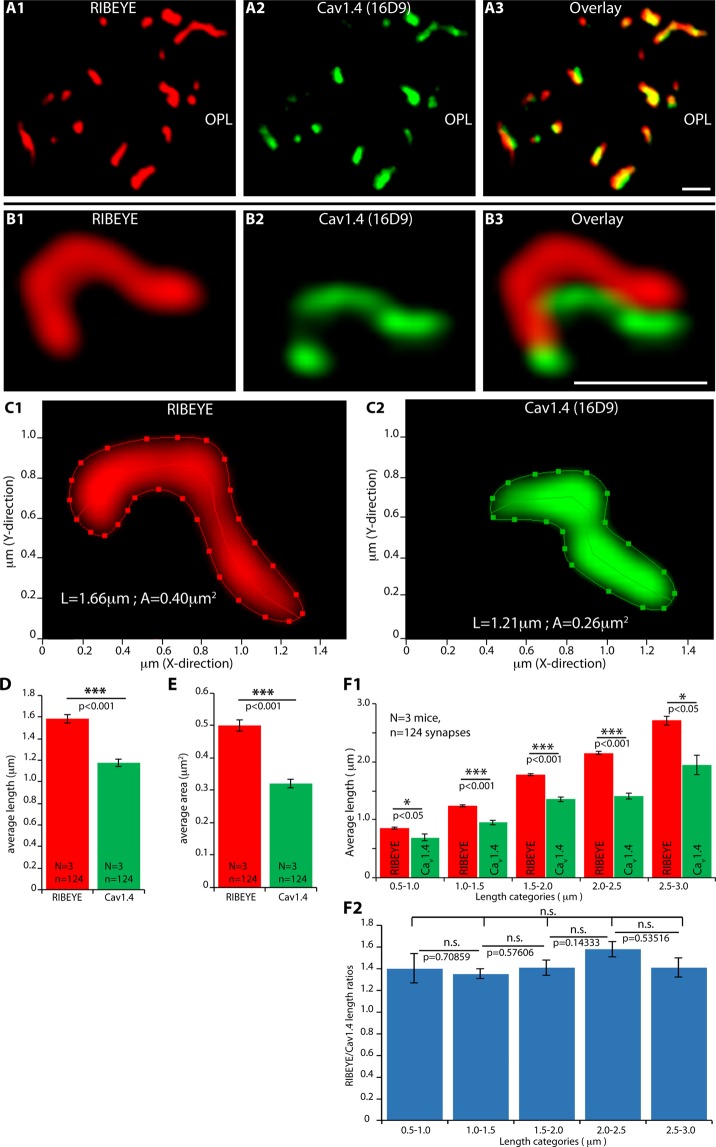
Confocal (A) and SR-SIM (B,C) analyses of rod photoreceptor synapses in the OPL immunolabelled with rabbit polyclonal antibodies against RIBEYE and mouse monoclonal antibodies (16D9) against Cav1.4. From the immunolabelled ribbon/active zone complexes, quantitative parameters (length [central line of the ribbon in C, shown as an example] and area [outer line, surrounding the immunosignal in C, shown as an example]) were determined (D,E). In (F1), all synaptic ribbons were subdivided into distinct length classes and analyzed for the respective length of the associated active zone (as measured by the length of Cav1.4-immunosignals). In (F2), the ratio between ribbon length/Cav1.4 length is displayed. Values are plotted as mean ± S.E.M. In (D,E,F1,F2). Abbreviations: OPL, outer plexiform layer. Scale bars: 1 μm.

