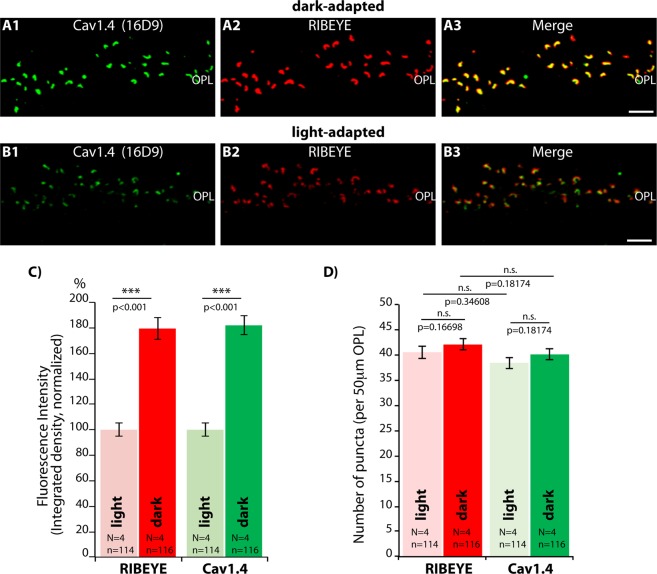
Figure 4.
Confocal analyses of photoreceptor synapses from light- and dark-adapted retinas immunolabelled with polyclonal antibodies against RIBEYE (U265614) and mouse monoclonal antibodies against Cav1.4 (16D9). (A,B) Representative confocal images of dark- and light-adapted retinas; (C,D) quantitative analyses of the strength of the immunofluorescence signals (measured as integrated density) in (C), quantitative analyses of immunolabelled puncta in (D). Values are plotted as mean ± S.E.M. In (C,D). Abbreviations: S.E.M., standard error of the mean; OPL, outer plexiform layer. Scale bars: 5 μm.

