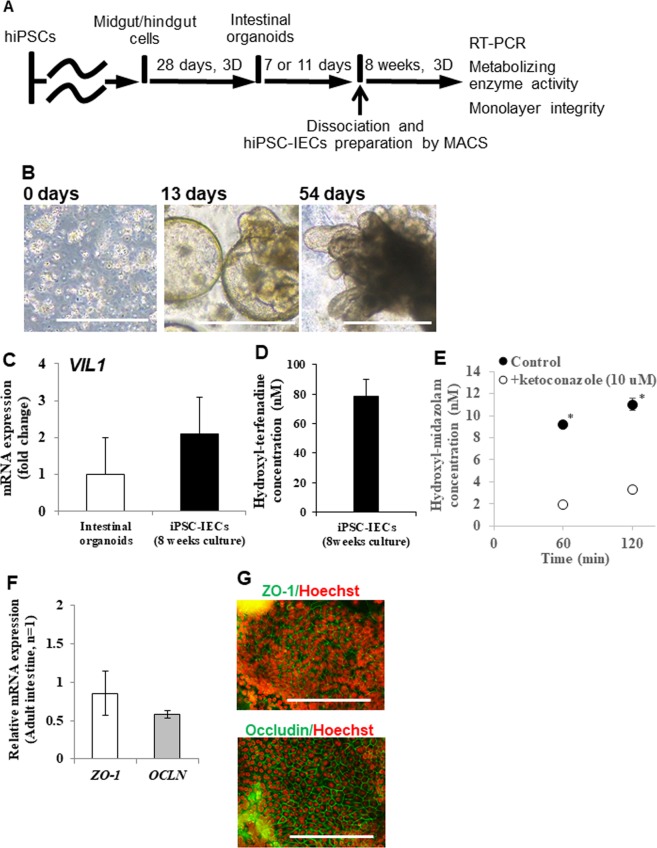
Figure 4.
Development of long-term culture method of hiPSCs-IECs. (A) Schematic procedure for long-term culture of hiPSCs-IECs. (B) Bright field images of hiPSC-IECs on days 0, 19 and 54 are shown. Scale bars represent 500 µm. (C) Enterocyte marker VILLIN gene expression in intestinal organoids and long-term cultured hiPSC-IECs are at similar levels. Data are presented as means ± S.D. (intestinal organoids: n = 19, long-term cultured hiPSC-IECs: n = 3) (D) Drug metabolic activity for terfenadine in 8-weeks-cultured iPSC-IECs. Data are presented as means ± S.D. (n = 3). (E) Drug metabolic activity for midazolam in 8-weeks-cultured iPSC-IECs. Data are presented as means ± S.D. (n = 3). *p < 0.01 versus the reaction with 10 µM ketoconazole. (F) Tight-junction maker (OCLN and ZO-1) gene expressions in hiPSC-IECs at day 32 post-seeding onto Transwell inserts after 8-weeks-cultured (n = 3). (G) Representative immuno-staining images of OCCLUDIN and ZO-1 in 8-weeks-cultured hiPSC-IEC monolayer after seeding on a culture plate. A scale bar represents 200 µm.

