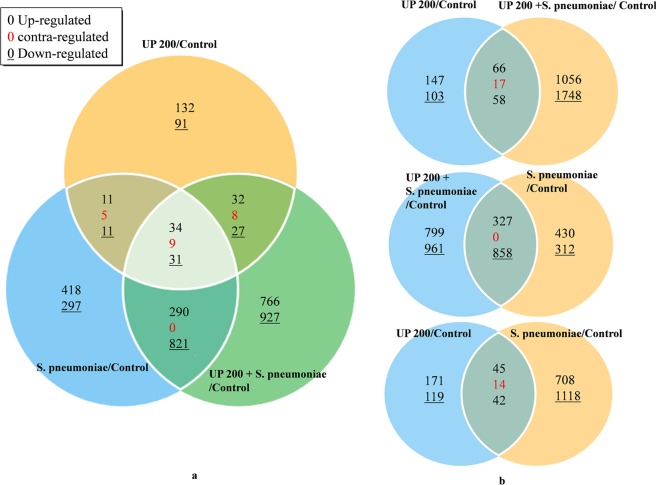
Figure 7.
Venn diagrams illustrating differential gene expression in HMEECs treated with urban particle, S. pneumoniae or co-treatment with respect to the control (untreated). The global gene expression analysis was performed using total RNA microarray analysis of HMEECs. (a) Differentially expressed gene in all three treatments with respect to untreated cells. (b) Venn diagram showing differentially expressed genes in HMEECs treated with UP, S. pneumoniae or co-treatment.

