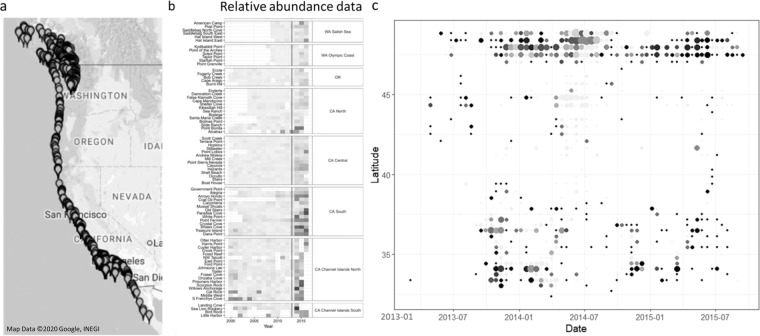
Figure 1.
Spatial outbreak pattern for sea star wasting disease in the ochre seastar Pisaster ochraceus. All observational data were gathered via a Citizen Science sampling initiative, in combination with the Multi-Agency Rocky Intertidal Network (MARINe), and are available on www.seastarwasting.org. Observations were in the form of species-specific presence/absence data, with sampling from both long-term research sites and citizen-selected locations. (a) Survey locations along the Pacific coastline of North America66. (b) Sea star density relative to pre-SSWD at multiple survey sites, with darker colors indicating greater decline (figure from Miner et al. 2018). The vertical line indicates the start of the SSWD epidemic. (c) The aggregation of survey data into 50 km × 14 day “windows”. The x-axis indicates time in days, with day 1 corresponding to January 1st, 2013, and the y-axis indicates latitude of 5 km cells, the resolution of the simulation. Proportion of “presence” surveys in each window is indicated by color, with brighter points showing a higher proportion.

