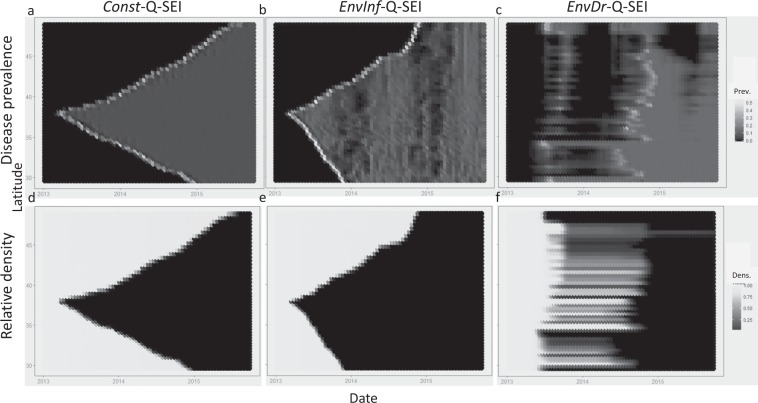
Figure 4.
Simulated spatial dynamics generated by the Const-Q-SEI, EnvInf-Q-SEI, and EnvDr-Q-SEI models. In the first two scenarios, the first infected individual is introduced into cell 250 at t = 20, the middle of a coastline discretized into an arbitrary n = 500 cells. For the EnvDr-Q-SEI model, the infection is pre-existing along the coastline. (a) Disease prevalence map for Const-Q-SEI model. The horizontal axis indicates time in days, the vertical one latitudinal location along the coastline. Shading indicates proportional prevalence of the symptomatic I class with darker colors representing lower prevalence. (b) Same as 4a, except for the EnvInf-Q-SEI model. (c) Same as 4a, except for the EnvDr-Q-SEI model. (d) Relative density map for the Const-Q-SEI model. Shading indicates abundance of all disease classes relative to initial pre-SSWD density, with dark colors representing low relative density. (e) Same as 4d, except for the EnvInf-Q-SEI model. (f) Same as 4d, except for the EnvDr-Q-SEI model.

