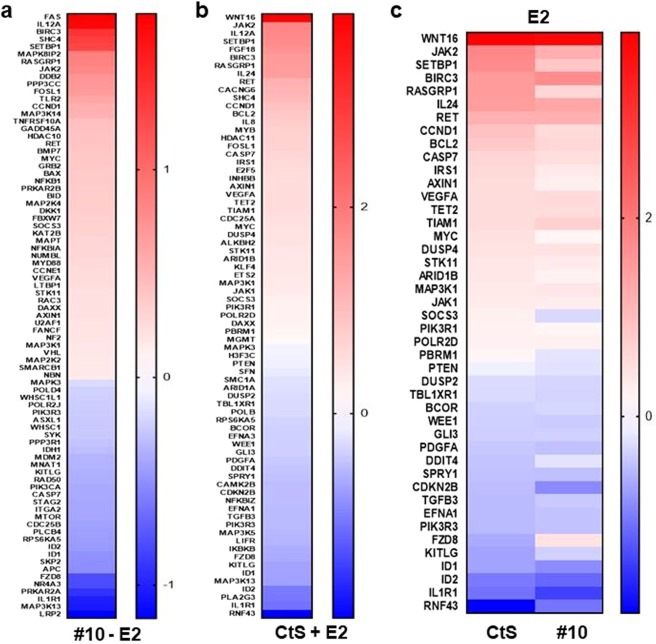
Figure 4.
Analysis of Gene Expression with the nCounter PanCancer Pathway Panel. MCF7 cells grown in 12-well tissue culture plates (9 × 10⁴ cells/well) in 10% CD-FBS medium for 48 h were transiently transfected using 10 nM of CtS or siRNA#10, generating four treatment groups: Group (1) CtS and −E2; (2) #10 and −E2; (3) CtS and +E2; (4) #10 and +E2. Forty-eight hours after transfection, cells were treated without (ethanol, 0.01%) as vehicle control or with 10−8 M of E2 for 3 hours. Total RNA (50 ng) was subjected to the nCounter PanCancer Pathway Panel gene expression analysis with nCounter Digital Analyzer. Quality control, data normalization and differential expression analyses were carried out using Nanostring nSolver 3.0 Analysis software together with its Advanced Analysis plug-in. Each treatment is depicted as heat maps with increasing (red) and decreasing levels (blue) and are the mean of three independent experiments in the log2 scale. (a) To assess differentially expressed genes mediated by CXXC5 in the absence of E2 (#10 −E2), nanostring results obtained from cells transfected with siRNA#10 in the absence of E2 (Group 2) was normalized to those from cells transfected with CtS in the absence of E2 (Group 1). (b) The effects of E2 on gene expression (CtS and +E2) were assessed by normalizing nanostring results obtained from cells transfected with CtS in the presence of E2 (Group 3) to those from cells transfected with CtS in the absence of E2 (Group 1). (c) To reveal the impact of CXXC5 on gene expressions in response to E2, we compared differentially expressed genes observed in the presence (CtS and +E2) and the absence (#10 and +E2) of CXXC5, the latter which was obtained by normalizing nanostring results obtained from cells transfected with siRNA#10 in the presence of E2 (Group 4) to those from cells transfected with siRNA#10 in the absence of E2 (Group 2).

