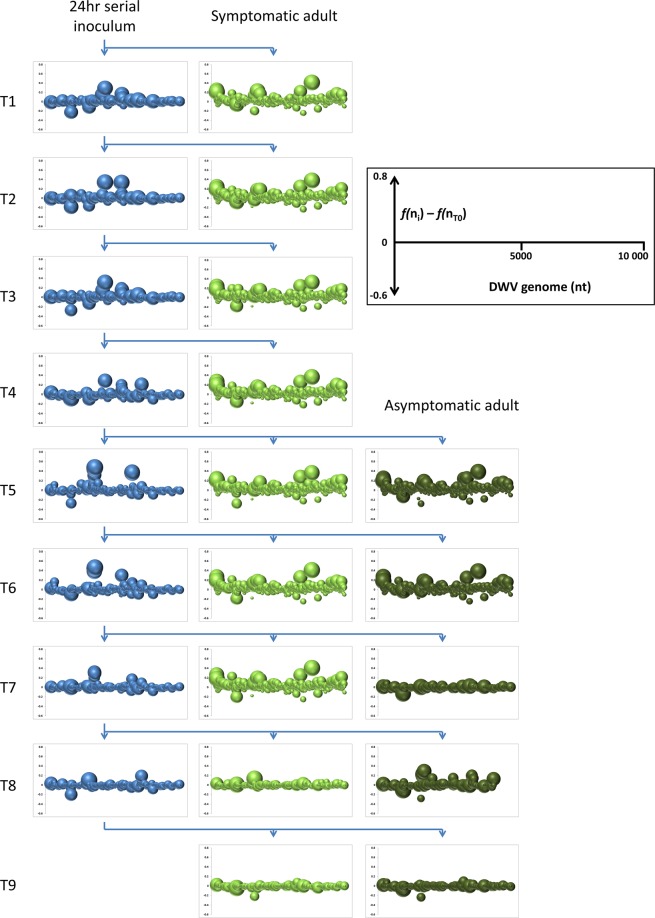
Figure 2.
Graphical representation of DWV quasispecies composition change during transmission. Bubble-graph representation of the difference in frequency (f) of the consensus nucleotide (n) at each nucleotide position along the 10 kb DWV genome (nt) between the experimental sample (f(ni)) and the original T0 inoculum (f(nT0)), shown for each of the successive 24-hour transmission inocula (blue; T1–T8) and their corresponding 7-day symptomatic (light green) and asymptomatic (dark green) adult transmission progeny. The size of each bubble represents the extent of the change in the sub-consensus nucleotide frequency along the DWV genome, i.e. those quasispecies with the smallest bubbles and the least amplitude are most similar to the original T0 inoculum.

