Figure 3.
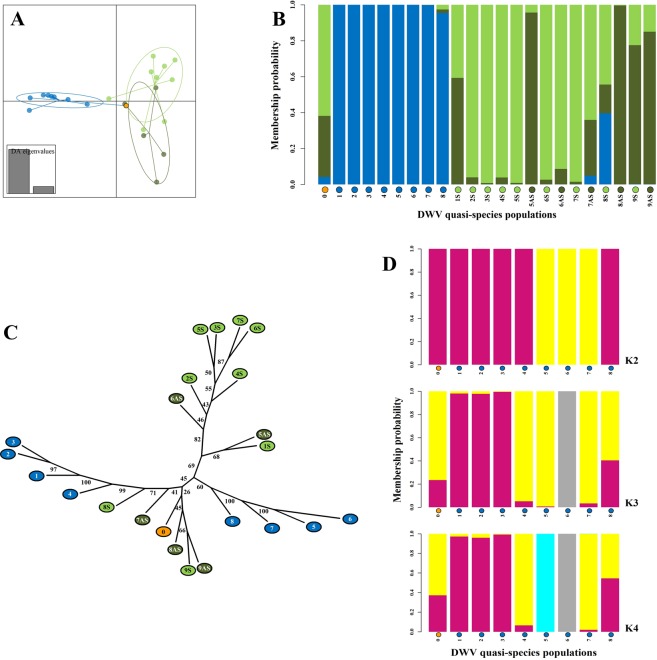
Clustering analyses of the DWV quasispecies. Discriminant Analysis of Principal Components (DAPC) and genetic clustering analyses of the DWV quasispecies nucleotide frequency data. Alleles were considered polymorphic with a Minor Allele Frequency (MAF) ≥ 0.02, resulting in 1,212 characters (about 12% of the DWV genome) from the 23 DWV quasispecies analysed. (A) Bounded scatterplot locating the 23 different quasispecies in a two-dimensional space, based on the principal data elements distinguishing the three sample types: inocula (blue), symptomatic adults (light green), asymptomatic adults (dark green). The orange dot marks the original T0 inoculum. (B) Compoplot showing the proportional genetic assignments of each quasispecies to the three genetic clusters defined by sample type. (C) Phylogenetic tree inferred from the allele frequency data using the Neighbour Joining algorithm implemented in PHYLYP (v.3.65c)93. Branch lengths represent genetic distance. Numbers along the branches represent statistical support for the branch, as determined by bootstrapping analysis (1,000 replicates). The sample types and order are marked by colour and number to identify each sequential 24-hour serial transmission inoculum (1–8: blue), and the matching symptomatic (-S: light green) and asymptomatic (-AS: dark green) adult inoculation progeny. (D) Unconstrained genetic clustering patterns with increasing K-clusters among DWV quasispecies of the 24-hour transmission inocula. The serial transmission proceeds from left to right, with the original T0 inoculum marked orange.

