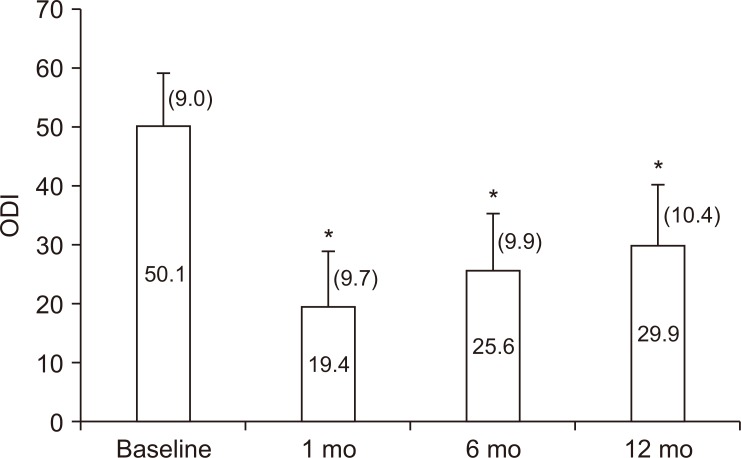
Fig. 2.
Mean disability scores (ODI) experienced by the study group over time. Exact mean and standard deviation values are indicated within each bar and adjacent to each whisker, respectively. ODI: Oswestry disability index. *Significantly different (P < 0.05) mean value compared to that at baseline.

