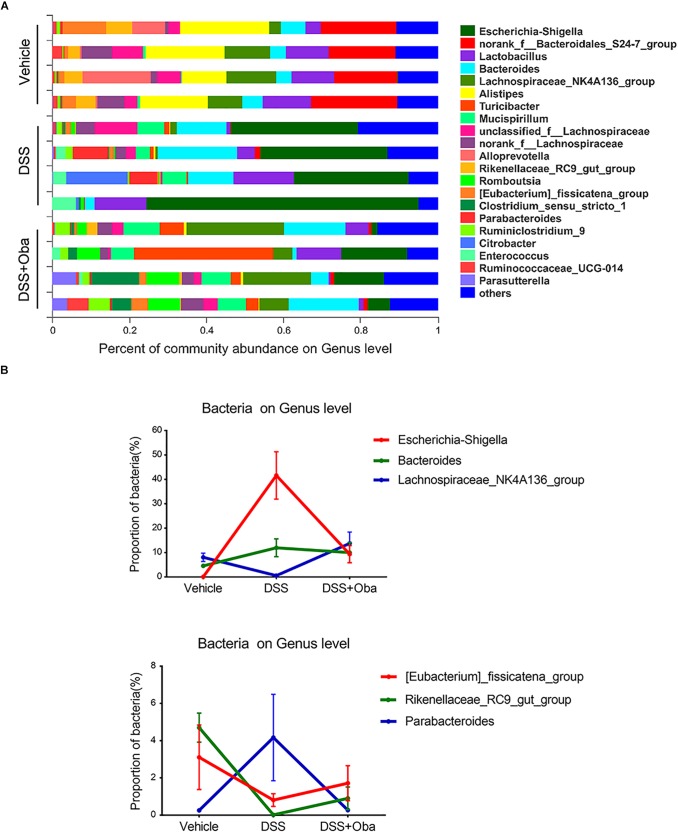
FIGURE 4.
Composition and abundance of gut microbiota at the genus level. (A) The proportion of dominant genera in each group of samples. Genus-level communities presenting in less than 5% of the samples were merged into others. (B) Distribution of Escherichia–Shigella, Bacteroides, Lachnospiraceae_NK4A136_group, (Eubacterium)_fissicatena_group, Rikenellaceae_RC9_gut_group, and Parabacteroides in each group. Data were expressed as the mean ± SD (n = 4 mice per group).

