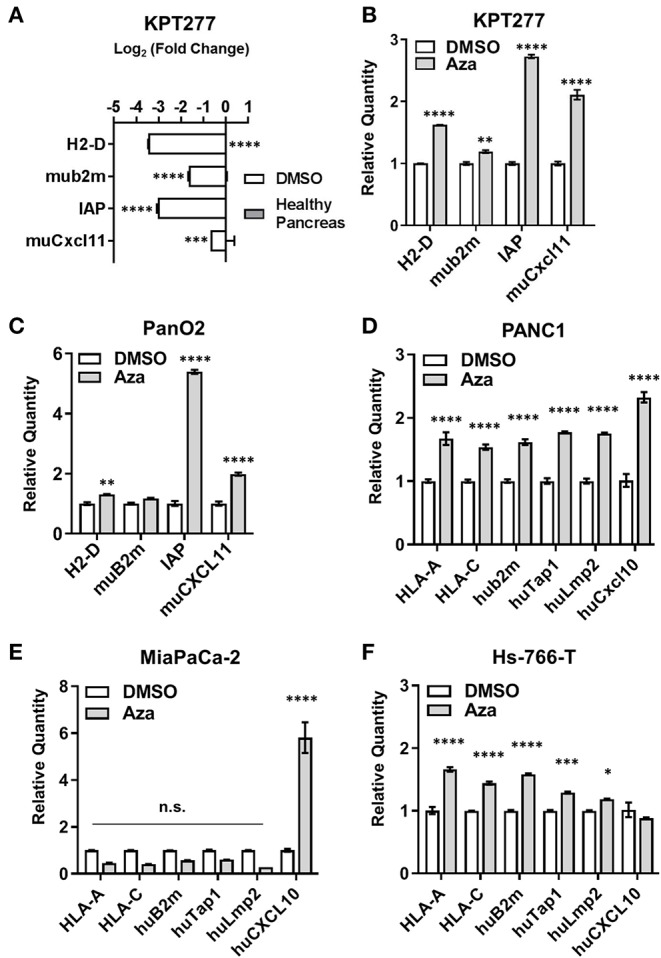
Figure 3.

Aza treatment augments antigen presentation- and T cell recruitment-related gene expression in mouse and human PDAC cells. qRT-PCR was performed on total RNA to assess gene expression for (A) KPT277 cells treated with DMSO for 96 h in vitro vs. healthy pancreas from a C57Bl/6 mouse, and (B) KPT277 cells treated in vitro with DMSO or 10 μM Aza for 96 h. (C) qRT-PCR for the mouse PDAC cell line Pan02 treated in vitro with DMSO or 5 μM Aza. (D–F) Human PDAC cell lines treated in vitro with DMSO or Aza (100 μM for PANC1; 10 μM for MiaPaCa-2; and 50 μM for Hs-766-T) for 96 h. In (A), bars represent Log base 2-fold change relative to “Healthy Pancreas.” n = 3 biological replicates. In (B) and (C–F), bars represent quantity of transcripts relative to vehicle (DMSO) for each gene. n = 3 biological replicates. p-values were assessed by[[Inline Image]] two-way ANOVA followed by Sidak's multiple comparisons test. *p < 0.05, **p < 0.01, ***p < 0.001, ****p < 0.0001. n.s. = not significant.
