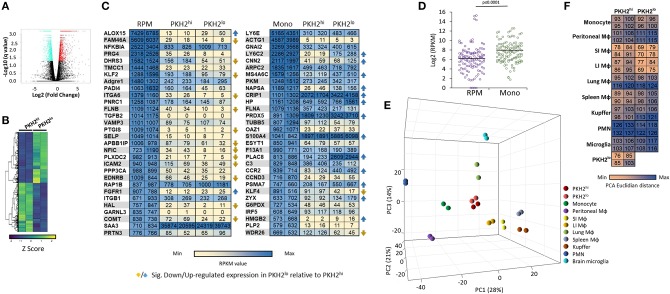
Figure 6.
Transcriptomic analysis of PKH2hi/phagocytic and PKH2lo/neg/non-phagocytic resolution phase macrophages. Male C57BL/6 mice were injected intraperitoneally with zymosan A (1 mg/mouse) followed by an injection of PKH2-PCL at 62 h. Four hours later, the peritoneal cells were recovered and immunostained for F4/80 and CD11b. Then, F4/80+ macrophages were sorted based on the extent of PKH2-PCL acquisition (PKH2hi vs. PKH2low/neg populations; >98% purity) using the FACSAria II sorter [as reported in (17)]. The collected cells were immediately used for RNA extraction (with RNA integrity value above 7.5), and a gene expression microarray analysis was performed using Illumina hiSeq 2500. Annotated genes were plotted using a volcano plot to identify the significant differentially expressed genes comparing PKH2hi and PKH2lo macrophages with significance depicted at q ≤ 0.05 values (A). Differentially expressed genes were examined across samples and hierarchically clustered into HeatMap of two lists: 1,690 up- and 1,752 down-regulated genes in PKH2lo relative to PKH2hi. Data presented are Z score normalized (B). Annotated genes were examined in comparison to various resident murine macrophage populations, as well as monocytes and PMNs [database from (7)]. The 30 highest expressed genes (on CPM-TMM scale) from either resident peritoneal macrophages (out of 282 exclusive genes) or monocytes (out of 272 exclusive genes) were compared to PKH2hi and PKH2lo/neg macrophages by RPKM values (C) and by distribution around the expression median values of each sample (D). Differential distances of PKH2hi and PKH2lo/neg macrophages from resident peritoneal macrophages and from monocytes were visualized on a 3D PCA plot (E) and enumerated as PCA Euclidian distances (F).

