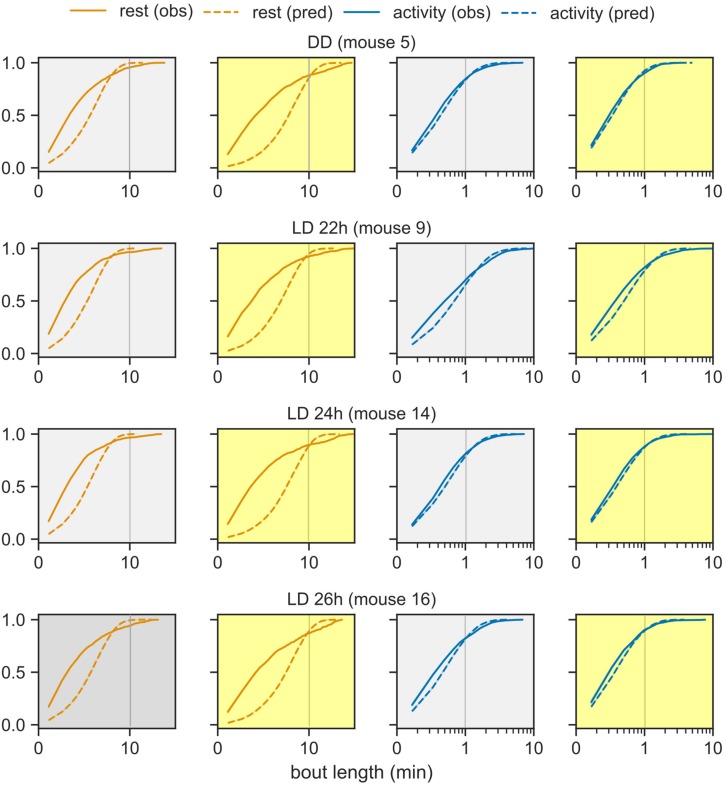
FIGURE 4.
Distribution of bout lengths of activity and rest. The observed distribution of bout lengths (solid lines) is compared against the distribution predicted by the model (dashed lines). The rest and activity bouts in the day and in the night are plotted in separate panels for one representative animal from each group: LD cycles of 22-, 24-, and 26- h and DD. The x-axis is plotted in logarithmic scale in order to see the very short and very long bouts in one graph. The color-coding from earlier figures is maintained.

