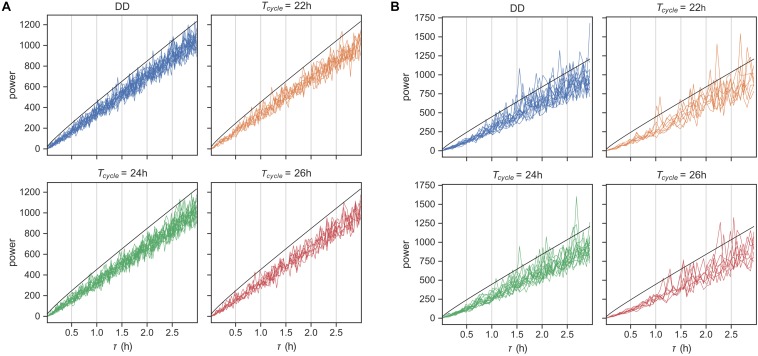
FIGURE 5.
Rhythms in behavior at ultradian time scales. χ2-periodogram analysis of behavioral data simulated using the probabilistic model in Figure 1 in panel (A) and for the original encoded data in panel (B). Simulated data matched the original data in number of replicates and length of data record. The periodograms are grouped according to the Zeitgeber input. The black line is the significance threshold for rhythmicity at the tested period with Bonferroni-adjusted p-value < 0.05.

