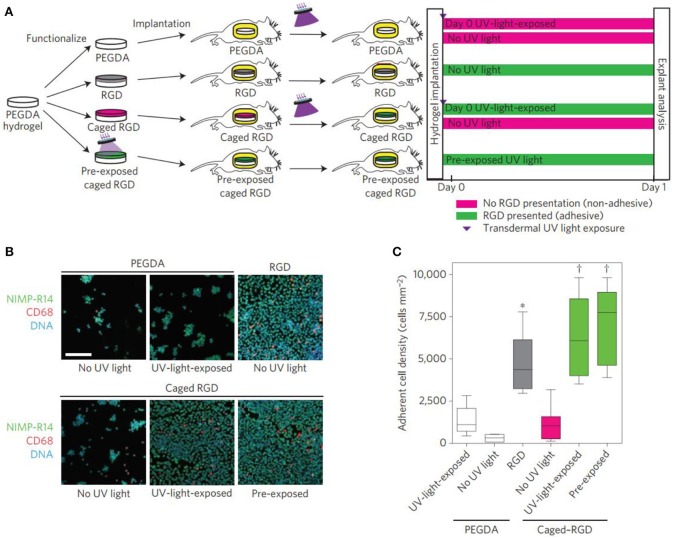
Figure 3.
Transdermal activation of in vivo inflammatory cell adhesion. (A) Schematic representation of the time line for in vivo activation of cell adhesion using transdermal UV light exposure. (B) Photographs of explanted hydrogels stained for adherent inflammatory cells (green, NIMP-R14 (neutrophil); magenta, CD68 (macrophage); blue, DAPI (DNA); scale bar = 80 μm). Reproduced with permission from Lee et al. (2015). (C) Adherent cell density, box-whisker plot for 6–8 mice per group, demonstrating light-based triggering of inflammatory cell adhesion to caged RGD-presenting implants. ANOVA p < 0.0001, ***p < 0.05 vs. UV-light-exposed PEGDA, †p < 0.001 vs. no-UV-light caged RGD.

