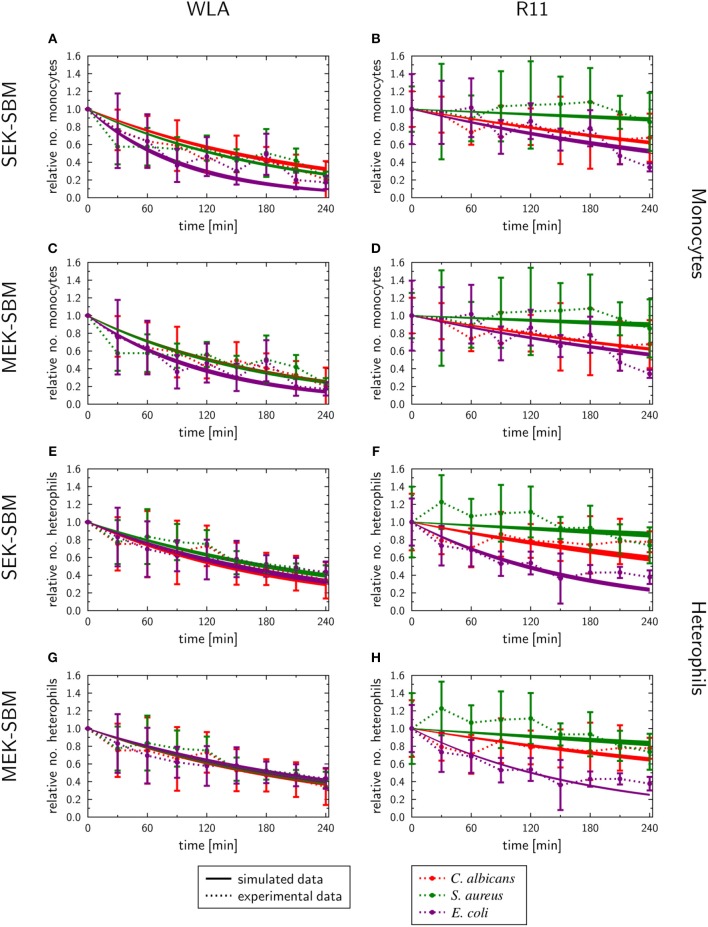
Figure 9.
SBM simulations of the immune cell numbers during infection. Time course of the monocytes (A–D) and heterophils (E–H) predicted units for pathogens in heterophils (PHe) and pathogens in monocytes (PM) that were simulated by the SEK-SBM (single extracellular killing mechanism of pathogens) and the MEK-SBM (multiple extracellular killing mechanisms of pathogens). Solid lines represent SBM simulations that were calibrated to experimentally measured data (data points connected by dashed lines as guide for the eye). The thickness of the solid lines represents the mean ± standard deviation of simulation results observed from 50 simulations for normally distributed transition rates. The models were calibrated to measurements of either C. albicans cells (red lines), E. coli cells (purple lines) or S. aureus cells (green lines) that were injected into samples from WLA chickens (left column) and R11 chickens (right column).

