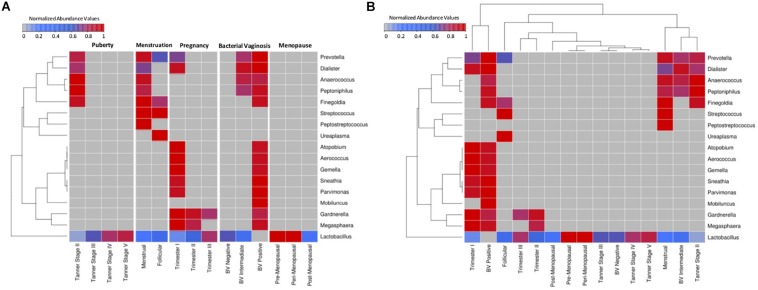
FIGURE 1.
Heatmap representing the taxonomic profiles of vaginal microbial communities at various reproductive and post-reproductive stages of women. Rank-normalized median abundance values (non-zero) of vaginal bacterial groups/taxa across all reproductive stages and post-reproductive of women has been plotted as a heat map. The cells highlighted in blue and red represent low and high abundance of the corresponding bacterial groups. (A) Given that the objective was to observe variations in the abundance pattern of each individual taxon across various reproductive sub-phases, median abundances values of each taxon were rank normalized across various reproductive sub-phases (and not across various taxa in each reproductive sub-phase). Data was therefore subjected to row-wise normalization rather than column-wise. (B) To observe taxonomic variations within each reproductive and post-reproductive stage, column-wise or stage-wise rank normalized median abundance values (non-zero) of vaginal bacterial groups are represented as a heatmap.

