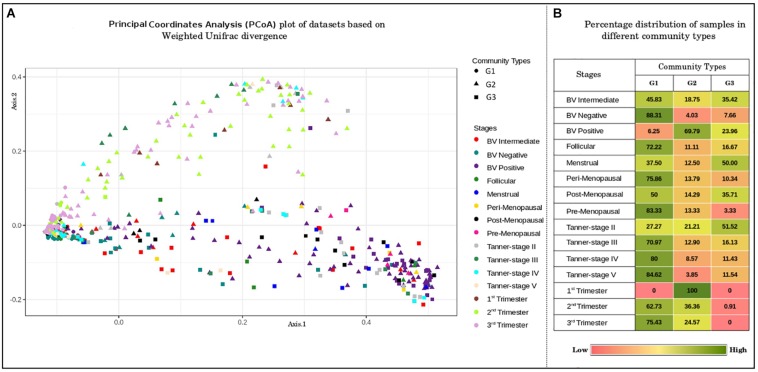
FIGURE 2.
(A) Principal coordinates analysis (PcoA) plot of datasets based on Weighted Unifrac divergence. The samples analyzed clustered into three distinct clusters/community types based on Weighted Unifrac divergence as a distance metric. Dirichlet Multinomial Mixtures probabilistic model was employed to obtain statistically optimum number of clusters/community types. The corresponding Dirichlet model fit plot representing the number of optimum clusters/community types for the datasets analyzed is provided as Supplementary Figure S2. (B) Percentage distribution of samples in different community types. Distribution of vaginal microbiome samples from discrete reproductive and post-reproductive stages in different community types. The samples from most of the stages are observed to cluster together in community type G1. Majority of the samples from stage BV-Positive and 1st trimester are observed to occur in community type G2. The community type G3 is found to constitute majority of samples from Tanner Stage II and Menstrual stage.

