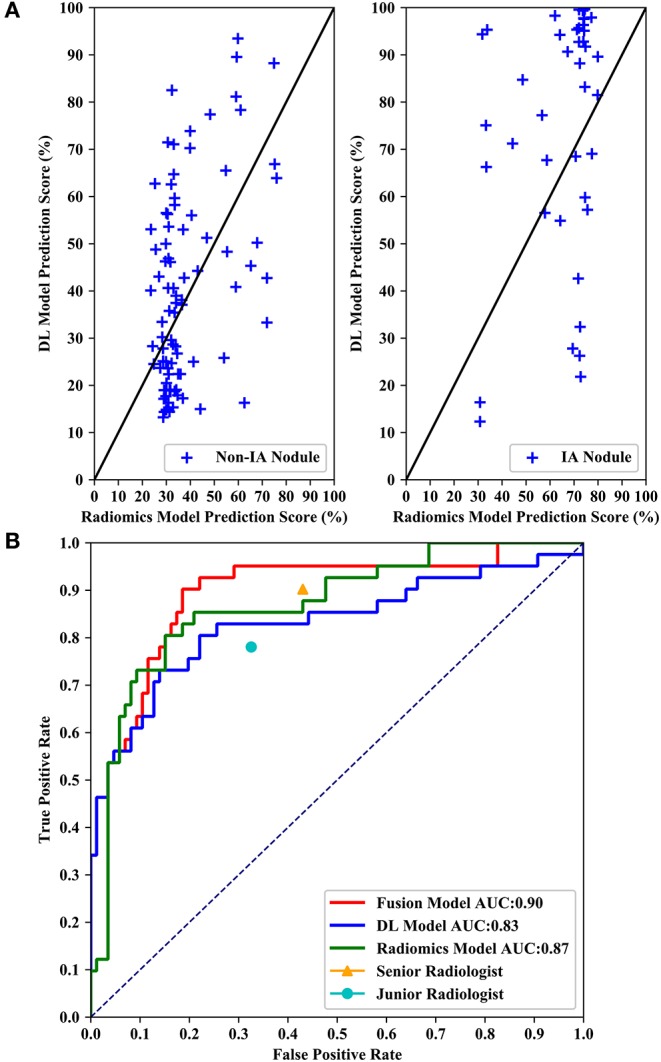
Figure 6.

Performance comparisons of three models and radiologists. (A) Shows scatter plots of prediction score distributions of non-IA and IA nodules. Left to right: prediction scores generated by DL and radiomics models for non-IA and IA nodules in testing dataset, respectively. (B) Shows ROC curves of the three models and the prediction scores of two radiologists.
