Figure 1.
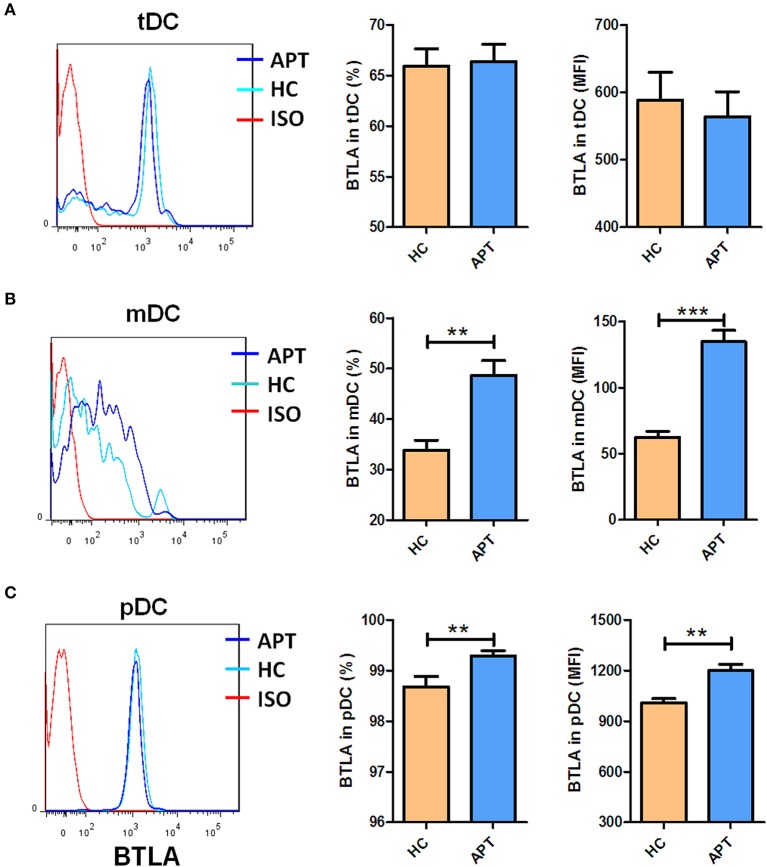
Active TB patients exhibited higher expression of BTLA in mDC and pDC subsets than HCs. PBMCs were prepared from patients with APT (n = 73) and HCs (n = 35). Cells were assessed for frequencies of BTLA-expressing DC subsets by flow cytometry. The gating strategy is shown in Figure S1. The left columns of (A–C) show the representative histograms for flow cytometry analysis of the expression of BTLA in tDCs (A) and its subsets mDCs (B), and pDCs (C). The middle columns of (A–C) show the mean frequencies of BTLA-expressing cells in tDCs (A) and its subsets mDCs (B) and pDCs (C). The right columns of (A–C) show the mean fluorescence intensity (MFI) of BTLA expression in tDCs (A) and its subsets mDCs (B) and pDCs (C). The P-value is shown in each column (Student t-test). **P < 0.01, ***P < 0.001.

