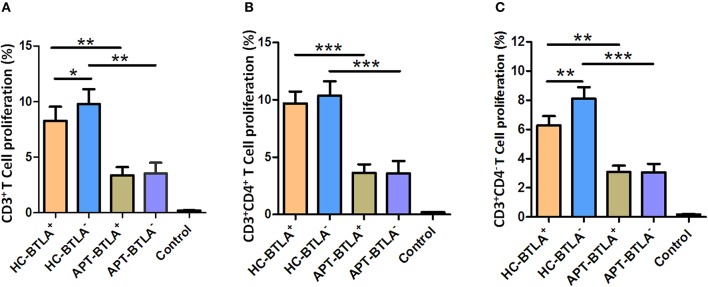
Figure 10.
BTLA+ DCs and BTLA− DCs in active TB patients exhibited a reduced capacity to induce allogeneic T cell proliferation. BTLA+ DCs and BTLA− DCs were sorted by flow cytometry from sputum smear-positive APT patients (n = 8) and HCs (n = 8). Moreover, CD3+ T cells were isolated from an allogeneic donor and labeled with CFSE. Allo-MLC was performed by mixing BTLA+ DCs or BTLA− DCs with allogeneic CD3+ T cell subsets, and T cell proliferation was determined by flow cytometry. (A) shows the flow cytometric histogram of the proliferation of CD3+ T cells stimulated by BTLA+ DCs and BTLA− DCs. (B,C) show T cell proliferation in CD3+CD4+ T cells (B) and CD3+CD4− T cells (C) stimulated by BTLA+ DCs and BTLA− DCs from the HC and APT groups, respectively. The P-values are shown in each column (ANOVA with the Dunnett post-hoc test). *P < 0.05, **P < 0.01, ***P < 0.001. In (A), P < 0.001 for HC-BTLA+ and HC-BTLA− vs. Control, but P > 0.05 for APT-BTLA+ and APT-BTLA− vs. Control. In (B), P ≤ 0.05 for all HC and APT groups vs. Control. For (C), P < 0.01 for all HC and APT groups vs. Control.

