Figure 2.
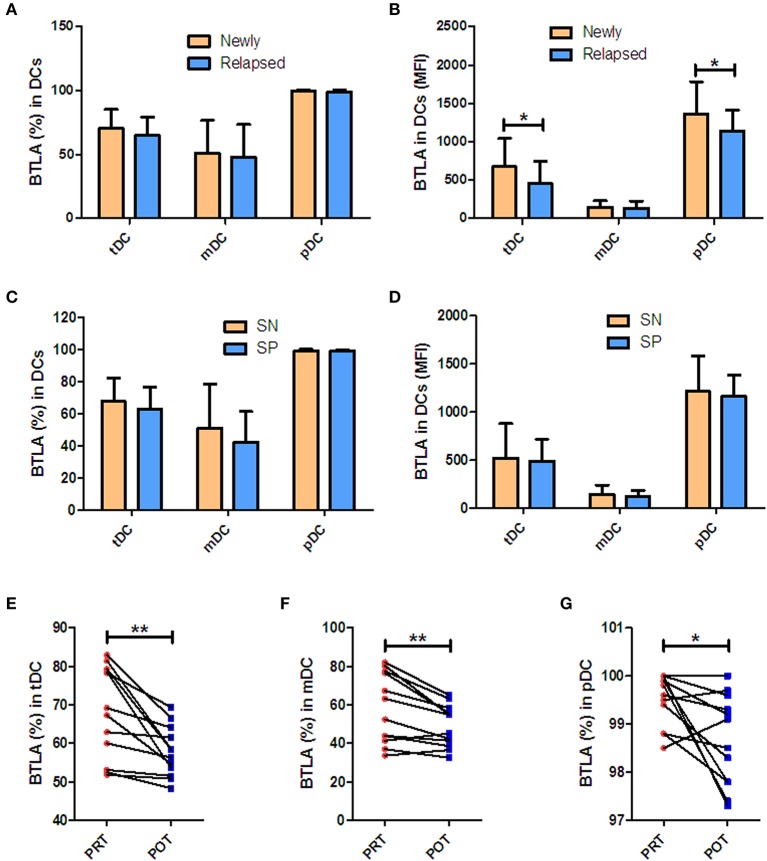
BTLA expression in Mtb infection patterns and after anti-TB therapy. (A,C) show percentages of BTLA+DCs in untreated TB (newly) vs. TB relapse (relapsed), and sputum-positive (SP) vs. sputum-negative (SN) patients, respectively. (B,D) show the MFI of BTLA on DCs in new vs. relapsed TB and SP vs. SN patients, respectively. (E–G) show the decrease in BTLA+ tDCs (E), mDCs (F), and pDCs (G) in PRT vs. POT of the new APT patients (n = 10). *P < 0.05, **P < 0.01 (Student t-test).

