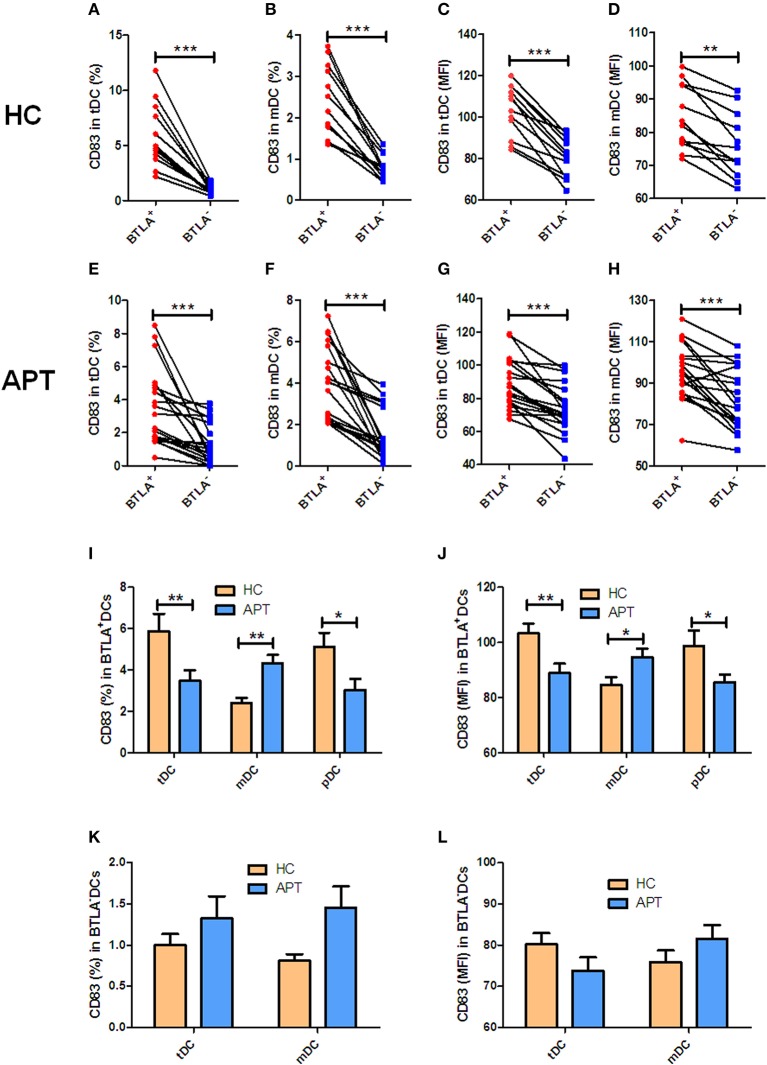
Figure 3.
BTLA+DCs in active TB showed a decreased expression of the DC maturation marker CD83. The expression of the maturation surface marker CD83 on DCs was determined by flow cytometry (n = 12). The gating strategy is shown in Figure S1. (A,B) show the positive rate (%) of CD83 expression between BTLA+ DCs and BTLA− DCs of HCs. (C,D) show the MFI of CD83 expression between BTLA+ DCs and BTLA− DCs in HCs. (E,F) show the positive rate (%) of CD83 expression between BTLA+ DCs and BTLA− DCs in APT patients. (G,H) show the MFI of CD83 expression between BTLA+ DCs and BTLA− DCs in APT patients. (I,J) show the positive rate (%) (I) and MFI (J) of CD83 expression in BTLA+ tDCs/mDCs/pDCs between HCs and APT patients. (K,L) show the positive rate (%) (I) and MFI (K) of CD83 expression in BTLA− tDCs and mDCs between HCs and APT patients. The P-value is shown in each column (Student t-test). *P < 0.05, **P < 0.01, ***P < 0.001.

