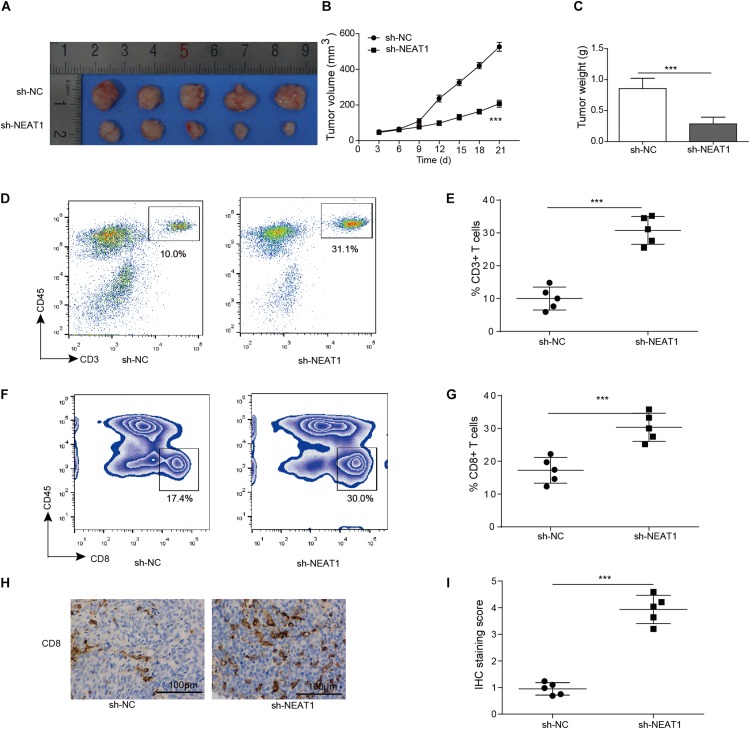
FIGURE 3.
Inhibition of NEAT1 suppresses tumor growth in vivo. Panels (A,B) BALB/c mice were challenged with 106 M109 cells subcutaneously, and tumor volume was assessed over time. (C) Tumor weight was recorded. (D) Representative plots of CD3 staining. Numbers indicated frequency of CD3+ T cells. (E) Frequency of tumor CD3+ T cells was analyzed by flow cytometry. (F) Representative plots of CD8 staining. Numbers indicate frequency of CD8+ T cells. (G) Frequency of tumor CD8+ T cells was analyzed by flow cytometry. (H) Representative image of CD8 staining by IHC. (I) IHC staining score of intratumor CD8+ T cells. ***p < 0.001. Data are expressed as the mean ± SD.

