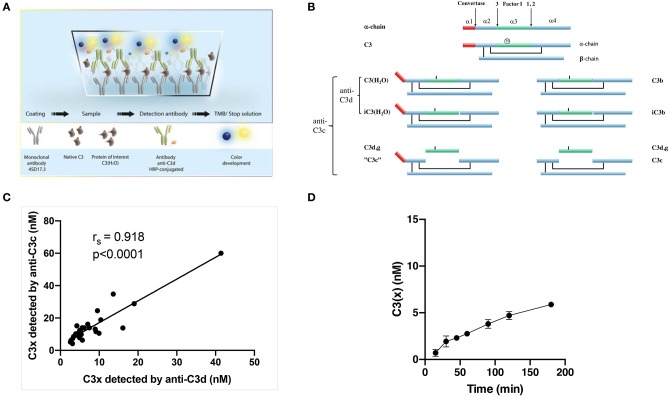
Figure 2.
(A) An illustration of the newly developed assay to measure non-proteolytically activated C3. (B) Schematic linear representation of native C3 [α-chain alone with indicated cleavage sites for convertases and Factor I appointed 1–3 (top of the figure) and the intact C3 molecule with a mark for the position of the thioester (below)], non-proteolytically activated C3 i.e., C3(x) (left) and C3 activated by convertases i.e., C3b (right) and their degradation fragments. The figure is adapted from Ekdahl et al. (25) with permission from the publisher. (C) Correlation between measured levels of C3(x) using anti-C3d or anti-C3c polyclonal antibodies for detection. (D) Measured C3(x) formation in plasma over time from 0 to 180 min.

