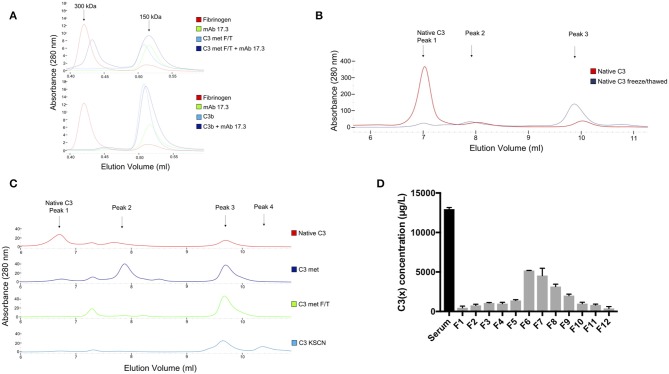
Figure 3.
(A) SEC analysis of complexes formed between anti-C3a mAb 4SD17.3 and F/T C3 (upper panel) and C3b (lower panel). Fibrinogen with a molecular weight of ca 300 kDa was used as a molecular weight marker with approximately the same size as formed complexes. (B) MonoS cation exchange chromatography analysis of native C3 (red line) and C3 after repeated F/T (blue line). (C) The corresponding MonoS analysis of native C3 (red line), methylamine treated C3 (darkblue line), methylamine treated C3 after repeated F/T (green line) and KSCN treated C3 (lightblue line). The identified main peaks are marked in the chromatogram. (D) C3(x) ELISA for identification of C3(x) in the fractions containing C3 collected from MonoS cation exchange chromatography separation of human serum sample after incubation at 37°Cover night (24 h). The serum sample was precipitated with PEG 4000 prior to application on the column.

