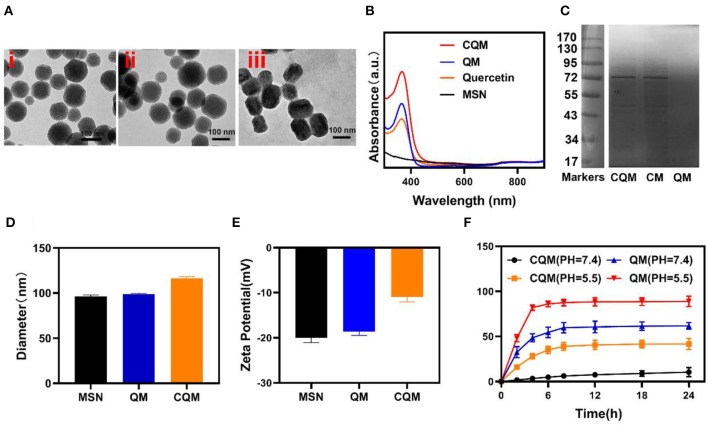
Figure 1.
Characterization of CQM nanoparticles. (A) TEM image of (i) MSNs, (ii) QM, and (iii) CQM. (B) Absorbance spectra of CQM, QM, QT, and MSNs. (C) SDS-PAGE protein analysis of CQM, CM, and QM. (D) Hydrodynamic diameter and (E) Zeta potential of MSN, QM, and CQM. (F) QT release profiles under different conditions.

