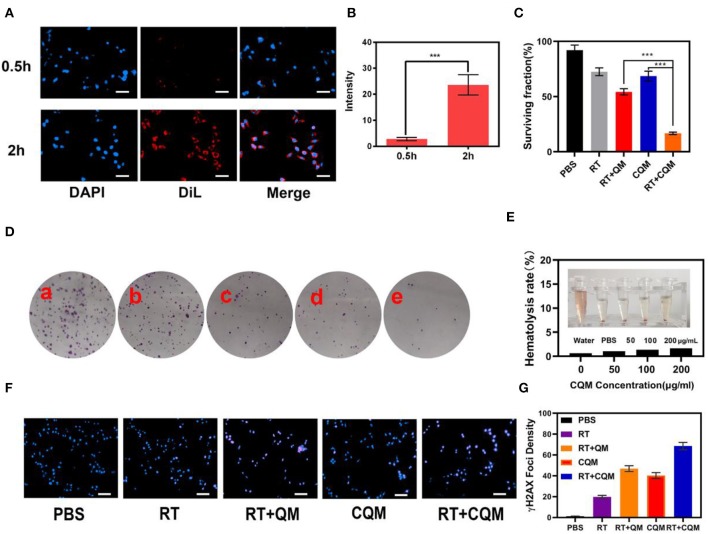
Figure 2.
Results of in vitro experiments. (A) Fluorescence images of 4T1 cells after treatment with CQM across time. Scale bars: 50 μm. (B) DiL fluorescence intensity of (A) measured using imageJ software. (C) Clonogenic 4T1 cell rate of survival when co-incubated with different formulations for 12 h prior to receiving RT or not. Colonies with >50 cells were counted. (D) 4T1 cells treated with (a) PBS, (b) RT, (c) CQM, (d) RT+QM, or (e) RT+CQM. The MSN concentration was 200 μg/mL and the irradiation dose was 4 Gy. (E) Hemolysis ratio of QM at different CQM concentrations. The inset presents the corresponding hemolysis images. (F) Representative fluorescence images of DNA fragmentation and nuclear condensation after different treatments. DAPI and γ-H2AX were used for nuclear visualization and DNA fragmentation, respectively. Scale bars: 50 μm. (G) Quantitative analysis of γ-H2AX foci density (γ-H2AX foci/100 μm−2) for n >100 cells in each treatment group. Significant differences among groups as calculated using the Student's t-test. ***P < 0.005.

