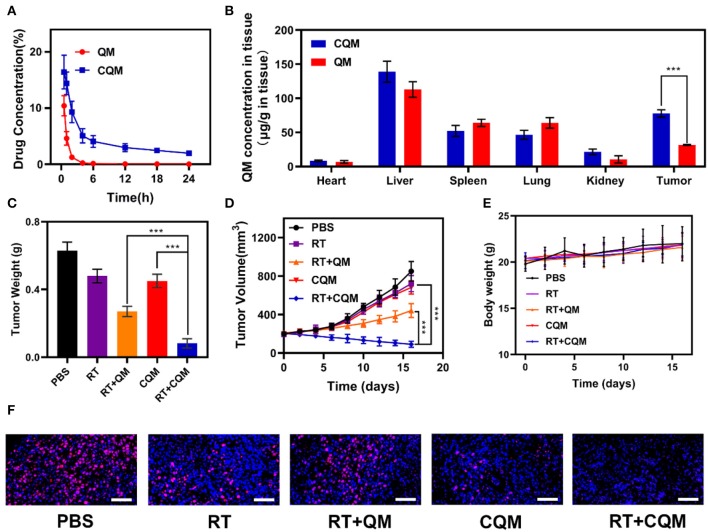
Figure 3.
Results of in vivo exposures. (A) Changes in tumor weight following treatment. (B) Change in tumor-volume curves of 4T1 tumor bearing mice after treatments. (C) Body weight of 4T1 tumor-bearing mice as recorded every 2 days following treatment. (D) Pharmacokinetic behavior of QM and CQM in mice following i.v. administration at doses of 5 mg/kg of MSNs. Data are presented as mean ± SD (n = 3). (E) Quantitative analysis of QM biodistribution in tissues and tumors of tumor-bearing mice injected with QM or CQM at MSNs dose of 5 mg/kg, respectively. (F) Representative Ki-67 stained tumor slice images of mice following treatment. Scale bars: 100 nm. Significant differences among groups as calculated using the Student's t-test. ***P < 0.005.

