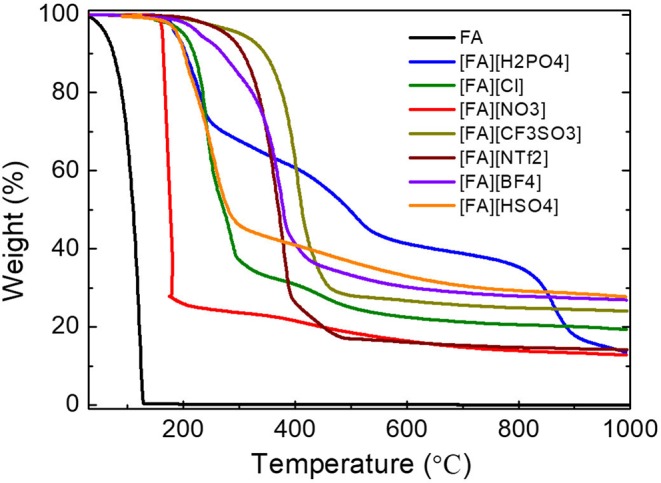
Figure 1.

TGA curves of fa and its PSs pairing with various anions (heating rate: 10°C/min under argon flow 200 mL/min). Note that [FA][NO3] was heated at a heating rate of 1°C min−1.

TGA curves of fa and its PSs pairing with various anions (heating rate: 10°C/min under argon flow 200 mL/min). Note that [FA][NO3] was heated at a heating rate of 1°C min−1.