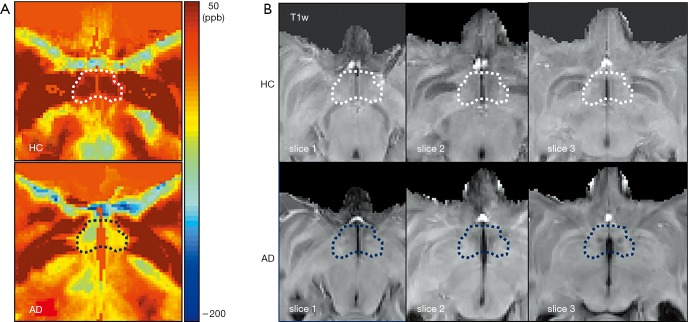
Figure 3.
Comparison of the hypothalamus shape between quantitative susceptibility mapping and T1w images. (A) The boundary of the hypothalamus (dotted lines, white in HC, dark blue in AD) is less marked in AD compared to HC. (B) The hypothalamic region of AD models, especially on slices 2 and 3 (dark blue dotted lines), shows decreased signal intensity on T1w images compared to that of the HC. The ventricle size is slightly enlarged with AD. HC, healthy control; AD, Alzheimer’s disease; T1w, T1-weighted image.

