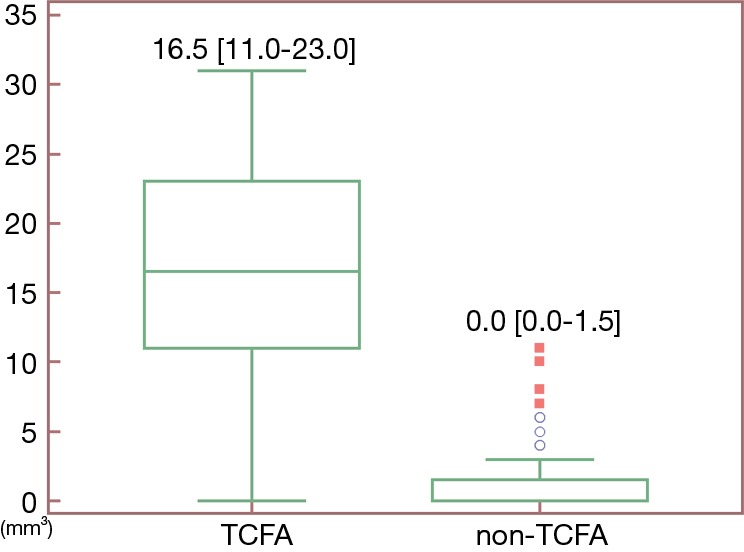
Figure 2.

Box plot showing the difference of LAP volume between TCFA and non-TCFA lesions. The LAP volume of TCFAs is significantly larger than that of non-TCFAs [16.5 (11.0–23.0) vs. 0 (0–1.5) mm3, P<0.001]. LAP, low attenuation plaque; TCFA, thin-cap fibroatheroma.
