Figure 3.

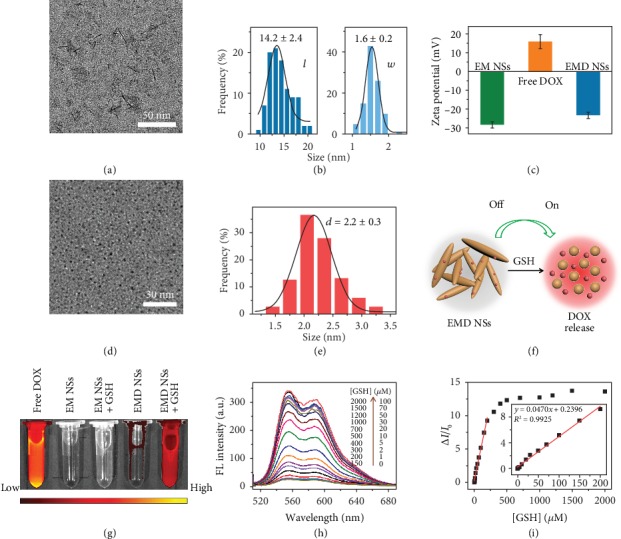
(a) TEM image of EMD NSs and (b) corresponding length (l) and width (w) histograms. An enlarged version of (a) was given in for clearer observation. (c) Zeta potential results of EM NSs, free DOX, and EMD NSs. (d) TEM image and (e) corresponding size histogram of EMD NSs after incubation with GSH (2.0 mM). (f) Schematic illustration of EMD NSs before and after GSH incubation. (g) FL images of different solutions/suspensions as indicated. Ex = 500 nm and Em = 620 nm. (h) GSH concentration- ([GSH]-) dependent FL spectra of EMD NSs. Ex = 500 nm. (i) Relationship between ΔI/I0 (at 555 nm) and [GSH] (0–2000 μM). Inset: linear fitting result of ΔI/I0 versus [GSH] in the [GSH] range of 0–200 μM.
