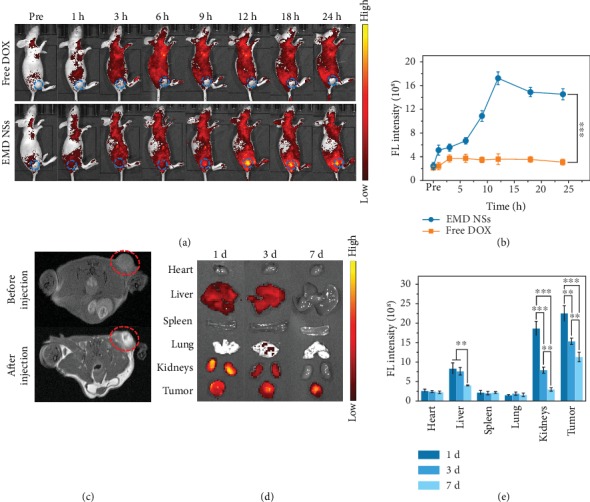
Figure 6.

(a) In vivo FL images of tumor-bearing mice before (“Pre”) and after i.v. injection of free DOX or EMD NSs (DOX concentration: 2 mg kg−1) for different time periods. The blue dotted circles mark the tumor regions. (b) Corresponding FL intensities in the tumor regions in (a). (c) In vivo MR images of a tumor-bearing mouse before and after i.v. injection of EMD NSs (DOX concentration: 2 mg kg−1) for 12 h. The red dotted circles mark the tumor regions. (d) Ex vivo FL images of major organs and tumor tissues of mice sacrificed at 1, 3, and 7 d post i.v. injection of EMD NSs (DOX concentration: 2 mg kg−1). (e) Corresponding FL intensities in organs or tissues in (d). ∗∗P < 0.01 and ∗∗∗P < 0.001.
