
Figure 5.
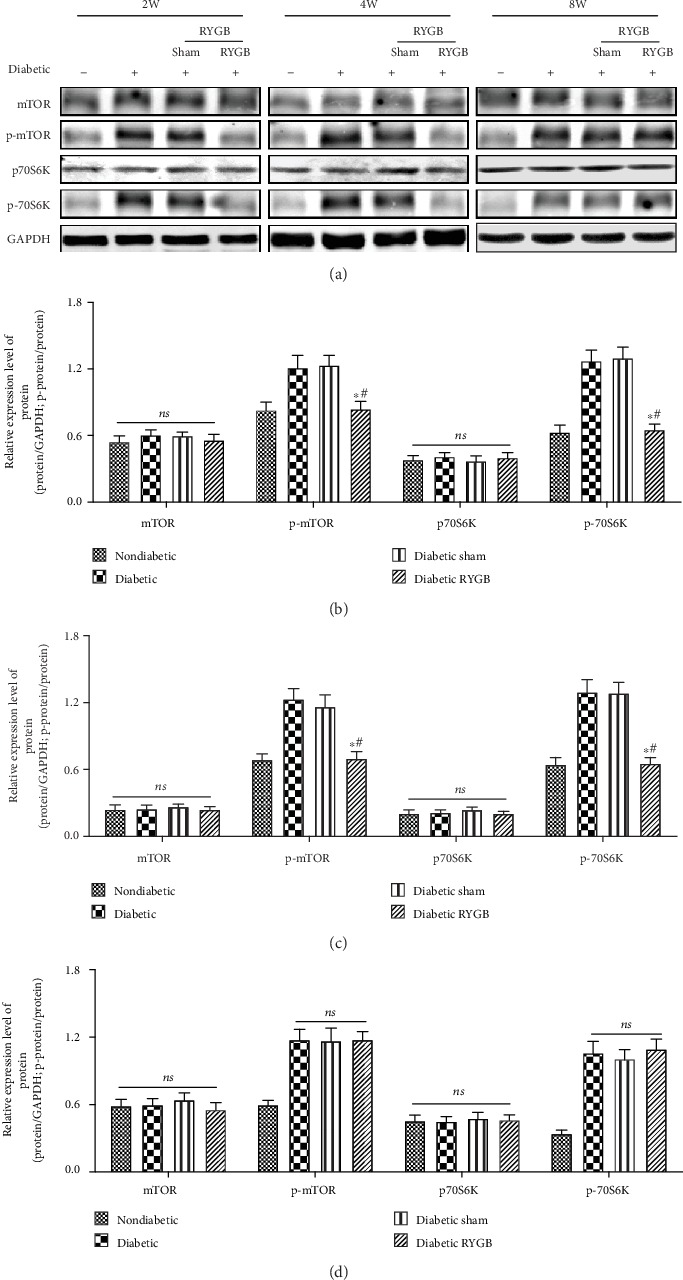
RYGB inhibits the mTOR/p70S6K signaling pathway (n = 8). (a) Western blot, (b) the bar graph of the expression levels of the mTOR/p70S6K signaling pathway of two weeks, (c) the bar graph of the expression levels of the mTOR/p70S6K signaling pathway of four weeks, and (d) the bar graph of the expression levels of the mTOR/p70S6K signaling pathway of eight weeks. All results are expressed as the mean ± SD. ∗Means P < 0.05 between diabetic group; #means P < 0.05 between diabetic sham group.