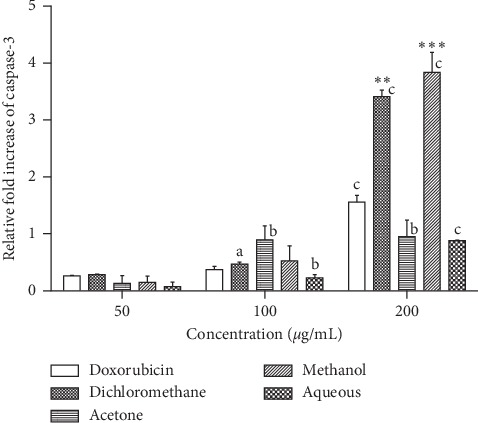
Figure 3.

Effects of SAHA extracts and doxorubicin on the activation of caspase-3 in RD cancer cells. Results are mean ± SD (n = 2). a represents significant difference (p < 0.01), b represents p < 0.001, and c represents p < 0.0001 when comparing to 50 μg/ml extract or 2 μg/ml doxorubicin. (∗∗) represents p < 0.01 and (∗∗∗) represents p < 0.001 when compared to 8 μg/mL doxorubicin.
