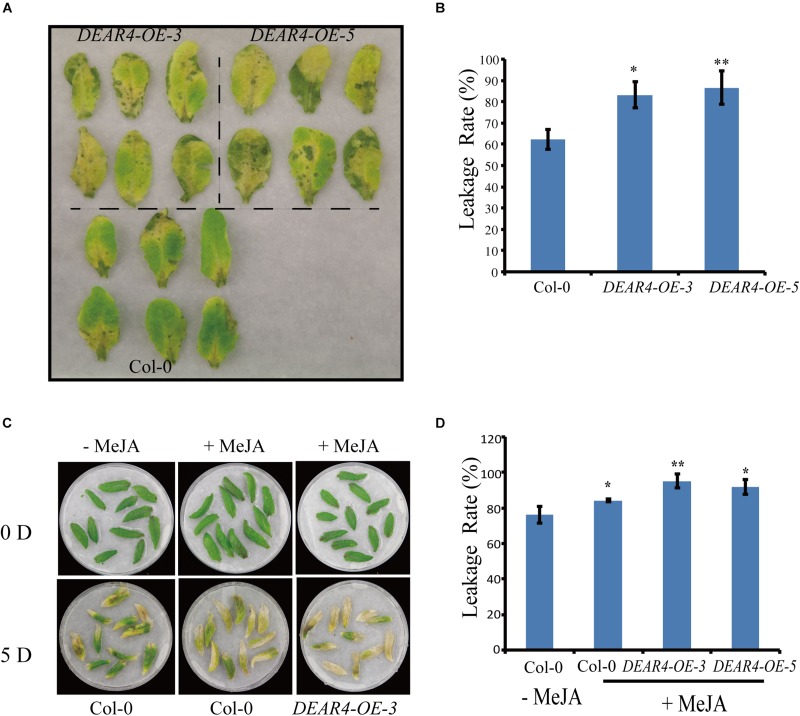
FIGURE 4.
Precocious senescence phenotypes of DEAR4 over-expression lines in dark conditions. (A) Phenotypes of detached leaves in response to dark condition. (B) Ion leakage rate in Col-0, DEAR4-OE-3, and DEAR4-OE-5. (C,D) DEAR4 over-expression plants showed enhanced sensitivity to JA. The bars are standard deviations (SD) of three biological replicates. The one and double asterisks indicate significant difference to control at the levels of 0.01 < P < 0.05 and P < 0.01 using student’s t-test, respectively.

