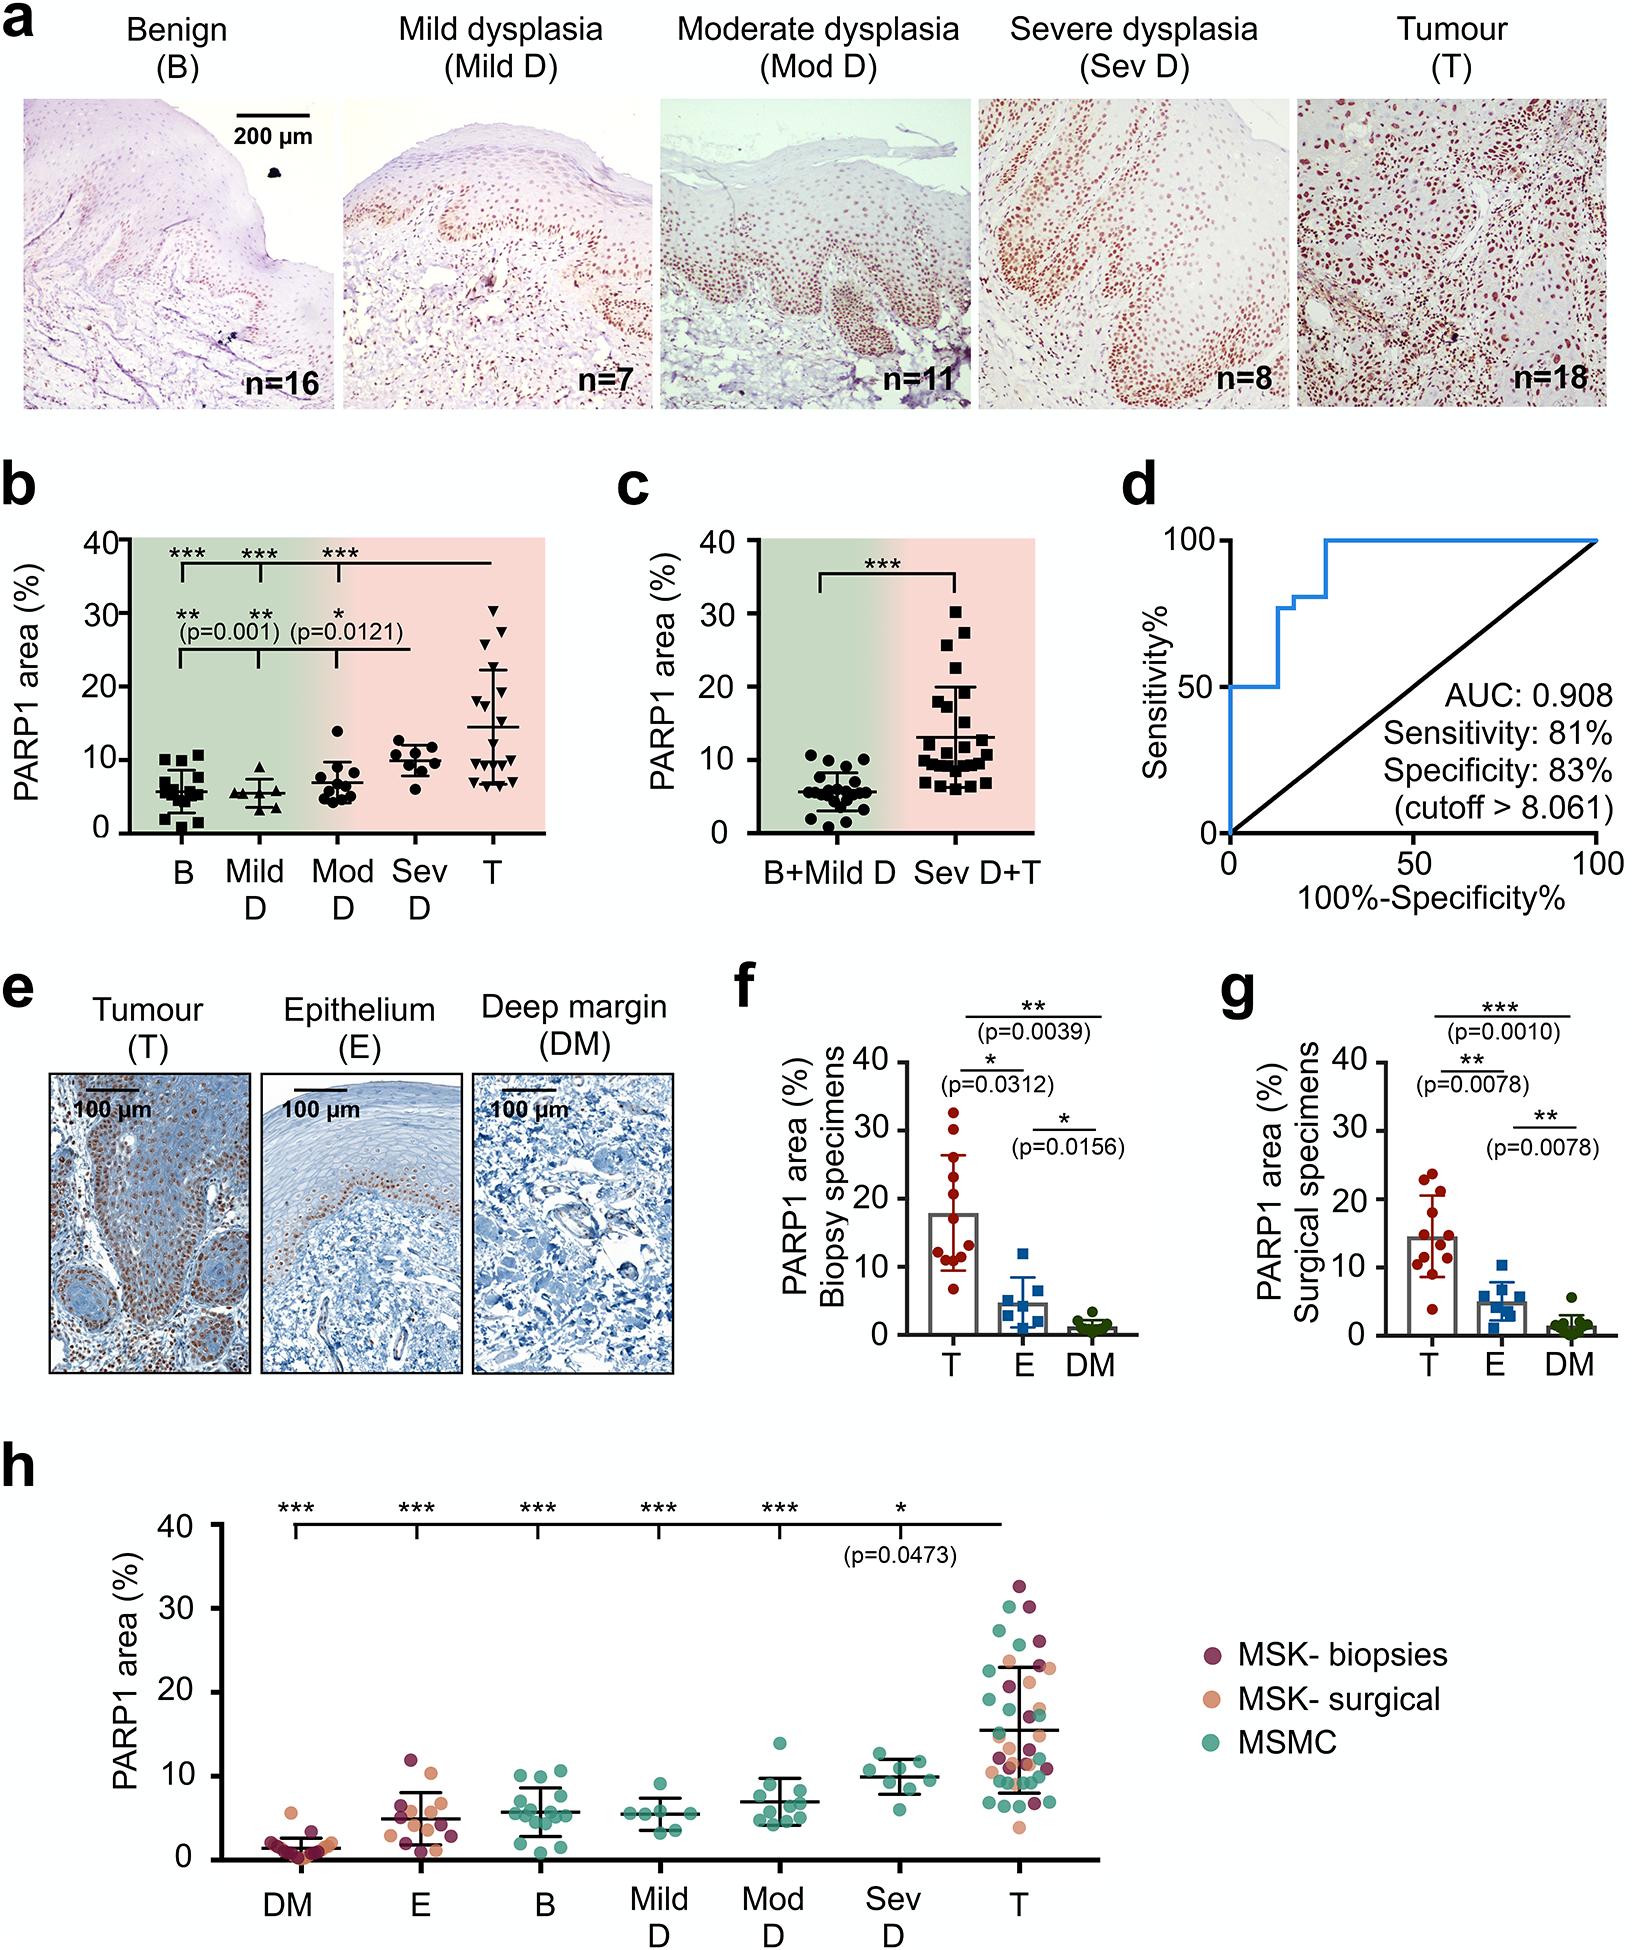
Fig. 4 |. PARP1 expression during malignant transition and at tumour margins in oral cancer.

a, Representative PARP1 IHC images in different stages of oral cancer progression (benign (n=16), mild dysplasia (n=7), moderate dysplasia (n=11), severe dysplasia (n=8), malignant(n=18)) of patient biospecimens from Mazumdar Shaw Medical Center (MSMC). b, Quantification of PARP1 expression in IHC samples (n=60 patients). The PARP1-positive area (in relation to the entire tissue area) was quantified in high-resolution images of the epithelium or tumour area (mean of n ≥ 4 images per case). Statistical significance was determined using an unpaired, two-tailed Mann-Whitney rank sum test. c, Comparison of PARP1 expression in low-grade, potentially malignant lesions (benign vs. mild dysplasia) vs. severe dysplasia (carcinoma in situ) and malignant cases. Statistical significance was determined using an unpaired, two-tailed Mann-Whitney rank sum test. ***p<0.001 d, ROC curve for the data represented in c. e, Representative images of PARP1 expression in samples from two populations: presurgical biopsies of tumour and benign tissues (divided in two areas: epithelium and deep margin) and surgical specimens, which included tumour, adjacent benign epithelium, and deep margin on each specimen. f, Quantification of PARP1 expression in IHC samples of biopsy specimens (n=12 patients). Statistical significance was determined using the Wilcoxon matched pairs signed rank test (two-tailed, n=6 pairs). g, Quantification of PARP1 expression in IHC samples of surgical specimens (n=12 patients). Statistical significance was determined using the Wilcoxon matched pairs signed rank test (two-tailed, n=8 pairs). A different analysis of the same dataset has been published previously26. h, Pooling of all three datasets of oral biospecimens investigated for PARP1 expression via IHC. Statistical significance was determined using the unpaired, two-tailed Mann-Whitney rank sum test. Full statistical analysis is reported in Table S1. T-Tumour.. E-Epithelium, DM-deep margin, D-dysplasia, mod-moderate, sev-severe, b-benign. Significance levels: *p<0.05, **p<0.01, ***p<0.001. Data are presented as mean ± standard deviation.
