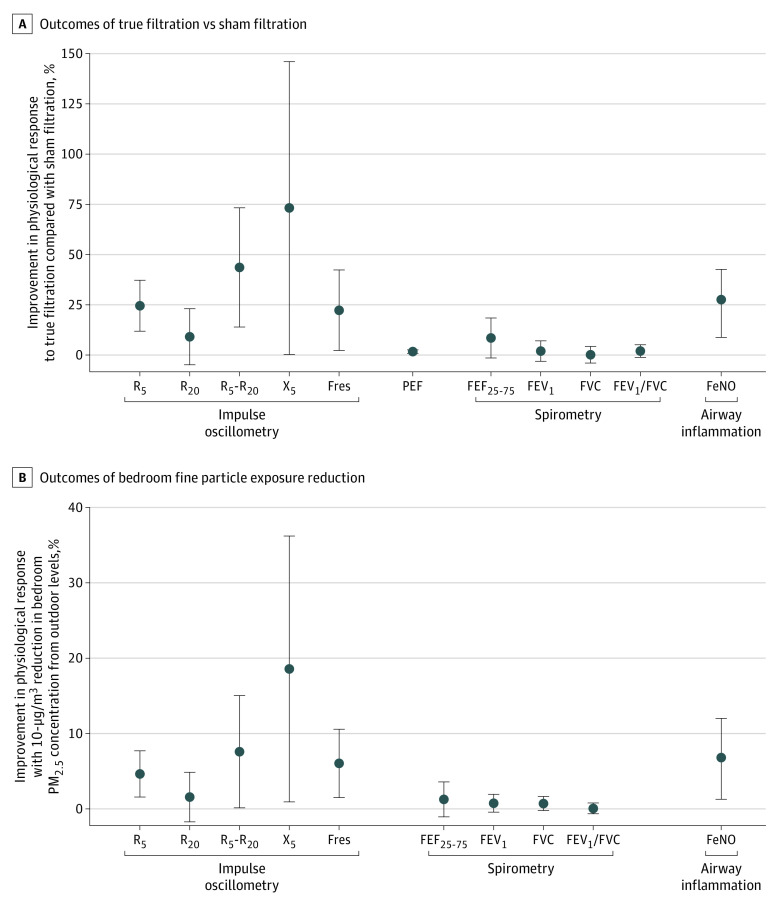
Figure 3. Outcomes Associated With True Filtration (vs Sham Filtration) and Bedroom Fine Particle (PM2.5) Exposure Reduction.
A, Outcomes of true filtration compared with sham filtration. For all outcomes except peak expiratory flow (PEF), the points and bars show mean and 95% CIs for outcome improvements when comparing filtration changes in outcome levels between true filtration and sham filtration. For PEF, the point and the bar show the mean and 95% CIs when comparing PEF values measured during the true filtration period with PEF values measured during the sham filtration period. For all outcomes, positive values indicate improvements and negative values indicate deterioration. For fractional exhaled nitric oxide (FeNO) data, the analysis was performed on log-transformed FeNO data and the result was converted back to untransformed data for presentation in this figure. B, outcomes associated with bedroom fine particle (PM2.5) exposure reduction. Points and bars show mean and 95% CIs for outcome improvements associated with a 10-μg/m3 reduction in bedroom PM2.5 concentration from outdoor levels. For all indicators, positive values indicate improvements and negative values indicate deterioration. For fractional exhaled nitric oxide (FeNO) data, the analysis was performed on log-transformed FeNO data, and the result was converted back to untransformed data for presentation in this figure. FEF25-75 indicates forced expiratory flow during 25% to 75% of forced vital capacity; FEV1, forced expiratory volume during the first second; Fres, resonant frequency; FVC, forced vital capacity; PM2.5, particulate matter smaller than 2.5 μm; R5, airway resistance measured at 5 Hz; R20, airway resistance measured at 20 Hz; R5-R20, the difference between R5 and R20, reflecting small airway resistance; X5, airway reactance measured at 5 Hz.

