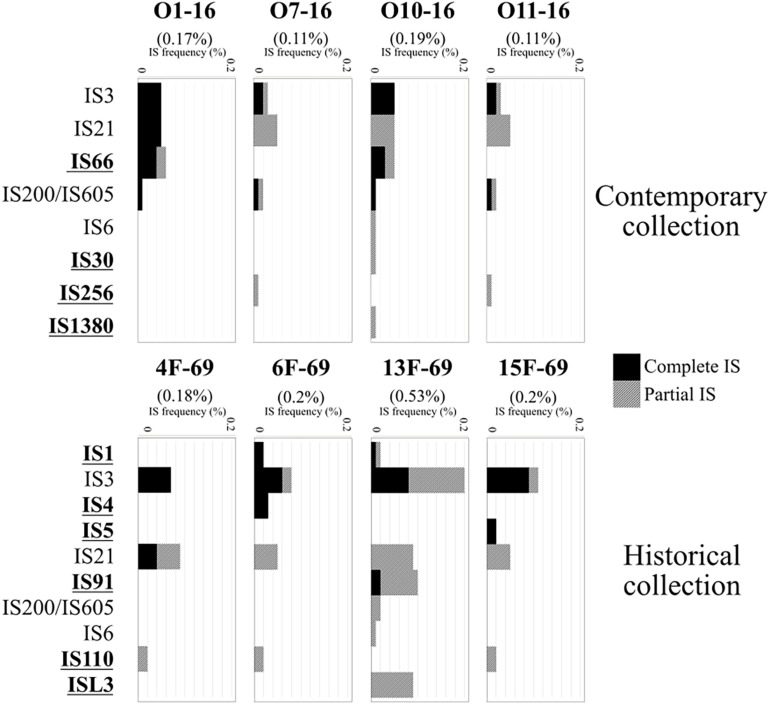
FIGURE 3.
Insertion sequences (ISs) detected in the eight Serratia marcescens studied isolates and their frequency in the annotated genomes, represented as IS bp/total genome bp (%). Total IS frequency in each genome is expressed in parentheses. ISEScan output included integral ISs and partially present ISs (black and gray bars, respectively). Bold, underlined IS labels were found only in one collection but not in the other.

