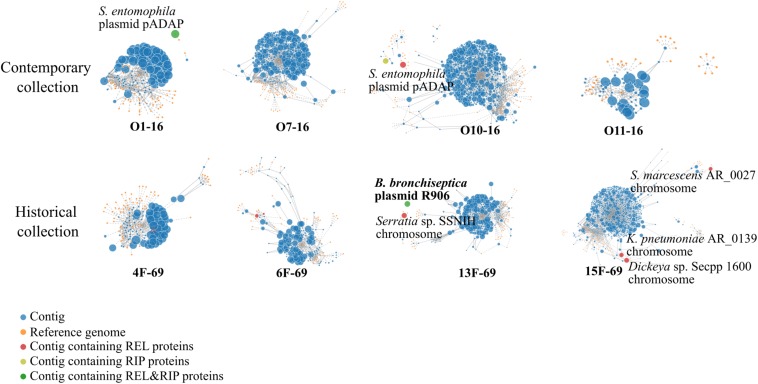
FIGURE 4.
PlacnetW output reflecting the plasmid sequences detected. All contigs from each genome are represented as blue nodes connected by continued lines. Yellow nodes represent reference genomes from the NCBI BLAST database. Discontinued lines link each contig to their closest reference genome/s. Finally, each genome appears represented by all its contigs displayed around their closest reference genome identity. Contigs containing plasmid sequences are highlighted in different colored nodes. REL, relaxase; RIP, replication initiation protein.

