Figure 1.

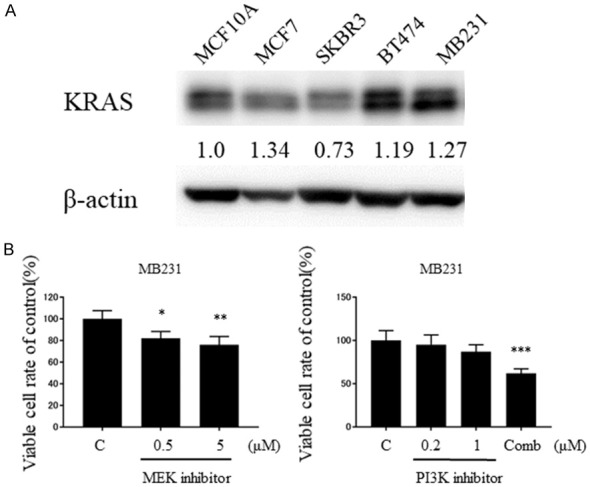
KRAS signaling was functioning in the breast cancer cell lines. A. Up-regulation of KRAS expression in breast cancer cell lines when compared with MCF10A. Densitometric values were calculated for KRAS. B. Cell growth suppression after transfection of MB231 cells with MEK inhibitor or PI3K inhibitor at 72 H. Comb: PI3Ki 1 + MEKi 5 (μM). *P < 0.05; **P < 0.01; ***P < 0.001.
